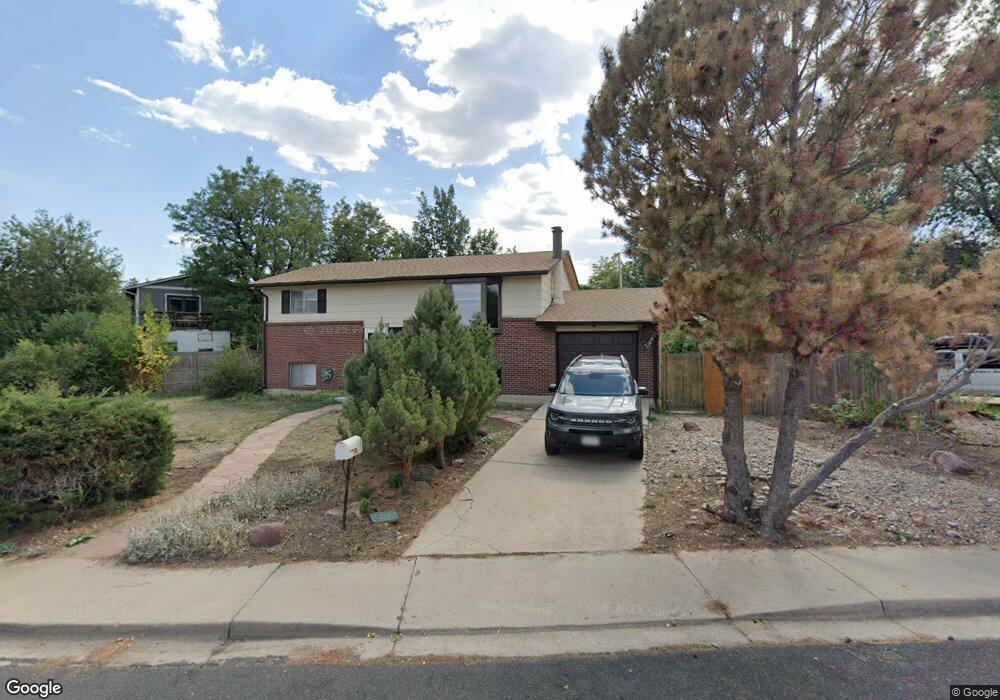
4637 Huey Cir Boulder, CO 80305
South Boulder NeighborhoodEstimated Value: $824,000 - $1,099,000
4
Beds
2
Baths
1,800
Sq Ft
$537/Sq Ft
Est. Value
About This Home
This home is located at 4637 Huey Cir, Boulder, CO 80305 and is currently estimated at $967,096, approximately $537 per square foot. 4637 Huey Cir is a home located in Boulder County with nearby schools including Creekside Elementary School, Southern Hills Middle School, and Fairview High School.
Ownership History
Date
Name
Owned For
Owner Type
Purchase Details
Closed on
Dec 12, 2013
Sold by
Boots Charles R and Freeman Boots Betty J
Bought by
Cr Services Llc
Current Estimated Value
Purchase Details
Closed on
Nov 15, 2010
Sold by
Jones Nancy Reece and Reece Nancy S
Bought by
Boots Charles R
Home Financials for this Owner
Home Financials are based on the most recent Mortgage that was taken out on this home.
Original Mortgage
$270,000
Interest Rate
4.27%
Mortgage Type
New Conventional
Purchase Details
Closed on
Apr 12, 1993
Bought by
C R Services Llc
Purchase Details
Closed on
Feb 23, 1993
Bought by
C R Services Llc
Purchase Details
Closed on
Aug 21, 1991
Bought by
C R Services Llc
Create a Home Valuation Report for This Property
The Home Valuation Report is an in-depth analysis detailing your home's value as well as a comparison with similar homes in the area
Home Values in the Area
Average Home Value in this Area
Purchase History
We collect this data history from publicly available records. To have your information removed, we recommend requesting removal directly through your county’s website.
| Date | Buyer | Sale Price | Title Company |
|---|---|---|---|
| Cr Services Llc | -- | None Available | |
| Boots Charles R | $360,000 | First Colorado Title | |
| C R Services Llc | $165,000 | -- | |
| C R Services Llc | -- | -- | |
| C R Services Llc | $104,500 | -- |
Source: Public Records
Mortgage History
We collect this data history from publicly available records. To have your information removed, we recommend requesting removal directly through your county’s website.
| Date | Status | Borrower | Loan Amount |
|---|---|---|---|
| Previous Owner | Boots Charles R | $270,000 |
Source: Public Records
Tax History
| Year | Tax Paid | Tax Assessment Tax Assessment Total Assessment is a certain percentage of the fair market value that is determined by local assessors to be the total taxable value of land and additions on the property. | Land | Improvement |
|---|---|---|---|---|
| 2025 | $5,764 | $64,852 | $37,747 | $27,105 |
| 2024 | $5,754 | $59,607 | $34,694 | $24,913 |
| 2023 | $5,652 | $64,575 | $40,997 | $27,262 |
| 2022 | $4,917 | $52,138 | $30,517 | $21,621 |
| 2021 | $4,692 | $53,640 | $31,396 | $22,244 |
| 2020 | $4,461 | $51,252 | $29,673 | $21,579 |
| 2019 | $4,393 | $51,252 | $29,673 | $21,579 |
| 2018 | $4,061 | $46,843 | $27,360 | $19,483 |
| 2017 | $3,934 | $51,788 | $30,248 | $21,540 |
| 2016 | $3,634 | $41,981 | $19,024 | $22,957 |
| 2015 | $3,441 | $33,106 | $12,736 | $20,370 |
| 2014 | $2,784 | $33,106 | $12,736 | $20,370 |
Source: Public Records
Map
Nearby Homes
- 4685 MacKy Way
- 1160 S Lashley Ln
- 4790 W Moorhead Cir
- 4844 W Moorhead Cir
- 4260 Whitney Place
- 1039 E Moorhead Cir
- 1542 Chambers Dr Unit 42
- 780 W Moorhead Cir Unit B
- 1380 Knox Dr
- 750 W Moorhead Cir Unit A
- 1466 Greenbriar Blvd
- 1566 Greenbriar Blvd Unit 132
- 725 S 45th St
- 1494 Greenbriar Blvd
- 1546 Greenbriar Blvd
- 4723 Tantra Dr Unit E6
- 4733 Tantra Dr Unit H6
- 4721 Tantra Dr Unit 6A
- 1533 Bradley Dr
- 1534 Bradley Dr Unit A202
Your Personal Tour Guide
Ask me questions while you tour the home.