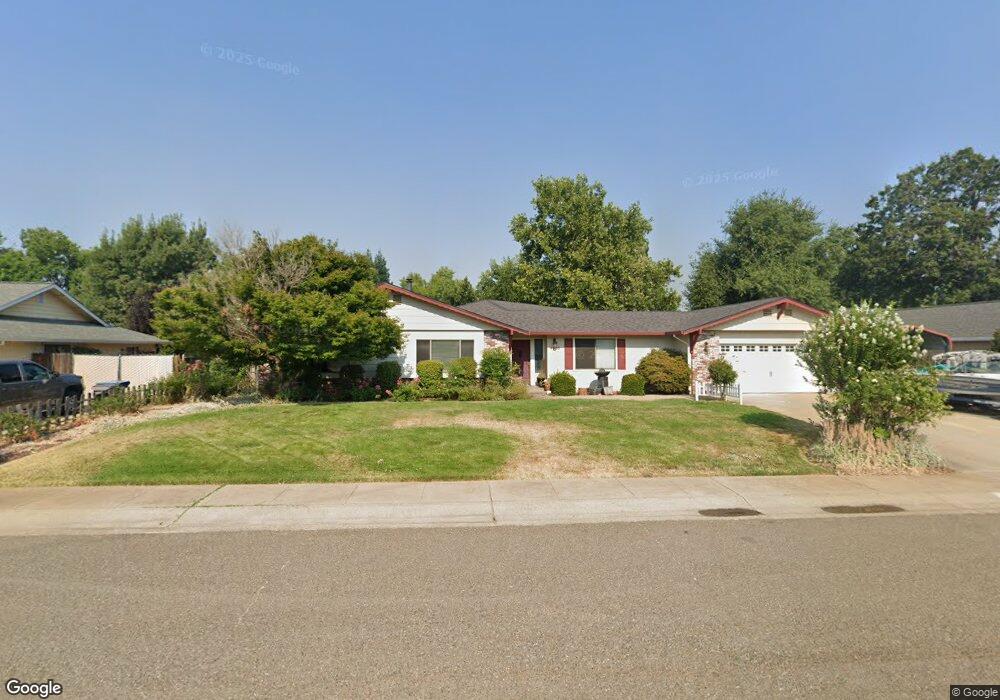
4638 Fiddleneck Dr Redding, CA 96002
Alta Mesa NeighborhoodEstimated Value: $410,000 - $461,000
3
Beds
2
Baths
1,922
Sq Ft
$226/Sq Ft
Est. Value
About This Home
This home is located at 4638 Fiddleneck Dr, Redding, CA 96002 and is currently estimated at $433,990, approximately $225 per square foot. 4638 Fiddleneck Dr is a home located in Shasta County with nearby schools including Lassen View Elementary School, Parsons Junior High School, and Enterprise High School.
Ownership History
Date
Name
Owned For
Owner Type
Purchase Details
Closed on
Sep 28, 2001
Sold by
Paschen Cynthia J
Bought by
Paschen Mark
Current Estimated Value
Home Financials for this Owner
Home Financials are based on the most recent Mortgage that was taken out on this home.
Original Mortgage
$117,000
Interest Rate
6.9%
Mortgage Type
Purchase Money Mortgage
Create a Home Valuation Report for This Property
The Home Valuation Report is an in-depth analysis detailing your home's value as well as a comparison with similar homes in the area
Home Values in the Area
Average Home Value in this Area
Purchase History
| Date | Buyer | Sale Price | Title Company |
|---|---|---|---|
| Paschen Mark | -- | First American Title Co |
Source: Public Records
Mortgage History
| Date | Status | Borrower | Loan Amount |
|---|---|---|---|
| Closed | Paschen Mark | $117,000 |
Source: Public Records
Tax History
| Year | Tax Paid | Tax Assessment Tax Assessment Total Assessment is a certain percentage of the fair market value that is determined by local assessors to be the total taxable value of land and additions on the property. | Land | Improvement |
|---|---|---|---|---|
| 2025 | $2,815 | $265,767 | $49,820 | $215,947 |
| 2024 | $2,774 | $260,557 | $48,844 | $211,713 |
| 2023 | $2,774 | $255,449 | $47,887 | $207,562 |
| 2022 | $2,695 | $250,442 | $46,949 | $203,493 |
| 2021 | $2,602 | $245,532 | $46,029 | $199,503 |
| 2020 | $2,590 | $243,016 | $45,558 | $197,458 |
| 2019 | $2,567 | $238,252 | $44,665 | $193,587 |
| 2018 | $2,536 | $233,582 | $43,790 | $189,792 |
| 2017 | $2,580 | $229,003 | $42,932 | $186,071 |
| 2016 | $2,412 | $224,514 | $42,091 | $182,423 |
| 2015 | $2,391 | $221,142 | $41,459 | $179,683 |
| 2014 | $2,372 | $216,811 | $40,647 | $176,164 |
Source: Public Records
Map
Nearby Homes
- 4733 Fiddleneck Dr
- 4624 Columbine Dr
- 4646 Alta Camino Dr
- 2000 Spur Ct
- 2364 La Madre Ct
- 5717 Churn Creek Rd
- 2366 Templeton Dr
- 99999 Churn Creek Rd
- 4813 St Charles Dr
- 4302 Paulson Ln
- 5521 Churn Creek Rd
- 2427 Castlewood Dr
- 2704 Western Oak Dr
- 4323 Churn Crk Rd
- 1513 Harpole Rd
- 2332 Venus Way
- 3086 Henrys Fork Dr
- 5016 Monaco Pkwy
- 3030 Clear Water Ct
- 2068 Solar Way
- 4650 Fiddleneck Dr
- 4645 Dandelion Dr
- 4635 Dandelion Dr
- 4622 Fiddleneck Dr
- 4653 Dandelion Dr
- 4658 Fiddleneck Dr
- 4625 Dandelion Dr
- 4647 Fiddleneck Dr
- 4661 Dandelion Dr
- 4627 Fiddleneck Dr
- 4640 Dandelion Dr
- 4667 Fiddleneck Dr
- 4648 Dandelion Dr
- 4674 Fiddleneck Dr
- 4656 Dandelion Dr Unit ONE
- 4656 Dandelion Dr
- 4615 Dandelion Dr
- 4669 Dandelion Dr
- 4607 Fiddleneck Dr
- 4632 Dandelion Dr
Your Personal Tour Guide
Ask me questions while you tour the home.