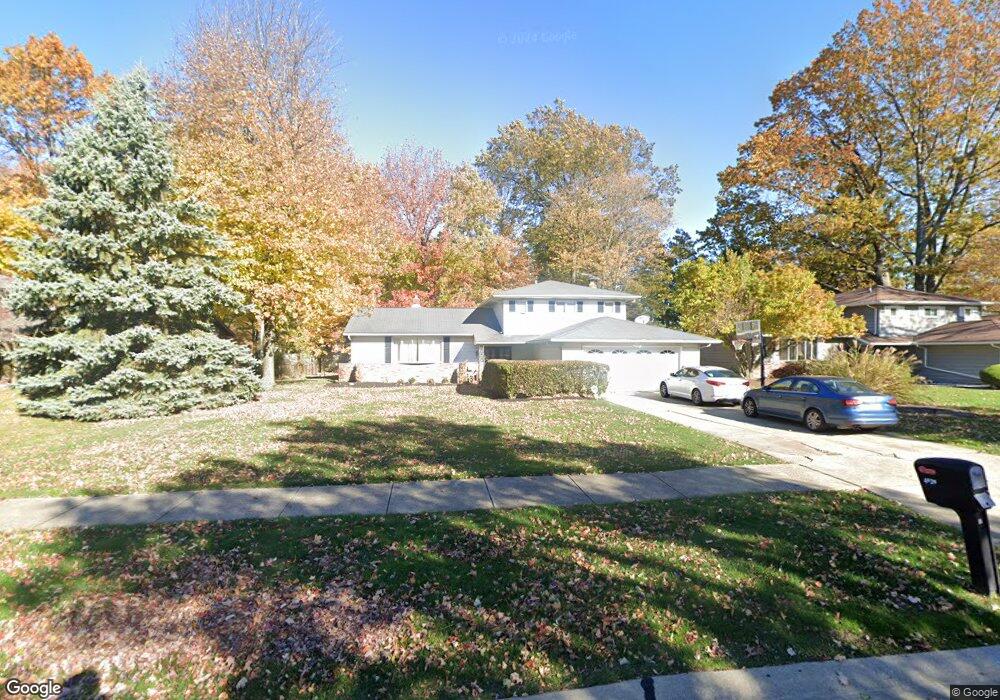
4639 Mcfarland Rd Cleveland, OH 44121
Estimated Value: $284,000 - $333,810
4
Beds
3
Baths
2,774
Sq Ft
$112/Sq Ft
Est. Value
About This Home
This home is located at 4639 Mcfarland Rd, Cleveland, OH 44121 and is currently estimated at $310,203, approximately $111 per square foot. 4639 Mcfarland Rd is a home located in Cuyahoga County with nearby schools including Adrian Elementary School, Greenview Upper Elementary School, and Memorial Junior High School.
Ownership History
Date
Name
Owned For
Owner Type
Purchase Details
Closed on
May 28, 2000
Sold by
King Stacy U and Miller King Pauline
Bought by
Bryant Roger L and Bryant Celest P
Current Estimated Value
Home Financials for this Owner
Home Financials are based on the most recent Mortgage that was taken out on this home.
Original Mortgage
$176,950
Outstanding Balance
$62,782
Interest Rate
8.31%
Mortgage Type
FHA
Estimated Equity
$247,421
Purchase Details
Closed on
Mar 7, 1997
Sold by
Moriarty John T
Bought by
Stacy U and Stacy Miller
Home Financials for this Owner
Home Financials are based on the most recent Mortgage that was taken out on this home.
Original Mortgage
$119,000
Interest Rate
7.93%
Mortgage Type
New Conventional
Purchase Details
Closed on
Jun 15, 1979
Bought by
Moriarty Angela M
Purchase Details
Closed on
Jan 1, 1978
Bought by
Kertesz Alex
Create a Home Valuation Report for This Property
The Home Valuation Report is an in-depth analysis detailing your home's value as well as a comparison with similar homes in the area
Home Values in the Area
Average Home Value in this Area
Purchase History
| Date | Buyer | Sale Price | Title Company |
|---|---|---|---|
| Bryant Roger L | $150,000 | Integrity Title | |
| Stacy U | $156,000 | -- | |
| Moriarty Angela M | $101,000 | -- | |
| Kertes Enterprises Inc | -- | -- | |
| Kertesz Alex | -- | -- |
Source: Public Records
Mortgage History
| Date | Status | Borrower | Loan Amount |
|---|---|---|---|
| Open | Bryant Roger L | $176,950 | |
| Previous Owner | Stacy U | $119,000 |
Source: Public Records
Tax History Compared to Growth
Tax History
| Year | Tax Paid | Tax Assessment Tax Assessment Total Assessment is a certain percentage of the fair market value that is determined by local assessors to be the total taxable value of land and additions on the property. | Land | Improvement |
|---|---|---|---|---|
| 2024 | $7,149 | $94,955 | $17,675 | $77,280 |
| 2023 | $7,193 | $77,150 | $14,530 | $62,620 |
| 2022 | $7,154 | $77,140 | $14,525 | $62,615 |
| 2021 | $7,097 | $77,140 | $14,530 | $62,620 |
| 2020 | $7,006 | $66,500 | $12,530 | $53,970 |
| 2019 | $6,385 | $190,000 | $35,800 | $154,200 |
| 2018 | $5,915 | $66,500 | $12,530 | $53,970 |
| 2017 | $5,648 | $53,840 | $10,680 | $43,160 |
| 2016 | $5,612 | $53,840 | $10,680 | $43,160 |
| 2015 | $5,441 | $53,840 | $10,680 | $43,160 |
| 2014 | $5,441 | $53,840 | $10,680 | $43,160 |
Source: Public Records
Map
Nearby Homes
- 4616 Mcfarland Rd
- 4643 Monticello Blvd
- 4742 Anderson Rd
- 868 Haywood Dr
- 4532 Anderson Rd
- 663 Monticello Place Ln
- 4772 Geraldine Rd
- 4832 Monticello Blvd
- 4860 Anderson Rd
- 4591 Wilburn Dr
- 4817 Donald Ave
- 4808 Geraldine Rd
- V/L Trebisky Rd
- 573 Trebisky Rd
- 684 Allison Dr Unit 684
- 1151 Berwick Ln
- 4838 Stacy Ct
- 963 Chelston Rd
- 4866 Fairlawn Rd
- 593 Dade Ln
- 4647 Mcfarland Rd
- 4631 Mcfarland Rd
- 4623 Mcfarland Rd
- 4655 Mcfarland Rd
- 4652 Monticello Blvd
- 4640 Mcfarland Rd
- 4672 Monticello Blvd
- 4648 Mcfarland Rd
- 4632 Mcfarland Rd
- 4632 Monticello Blvd
- 4656 Mcfarland Rd
- 4624 Mcfarland Rd
- 4615 Mcfarland Rd
- 800 Trebisky Rd
- 4663 Mcfarland Rd
- 4680 Monticello Blvd
- 832 Trebisky Rd
- 4603 Mcfarland Rd
- 4624 Monticello Blvd
- 836 Trebisky Rd