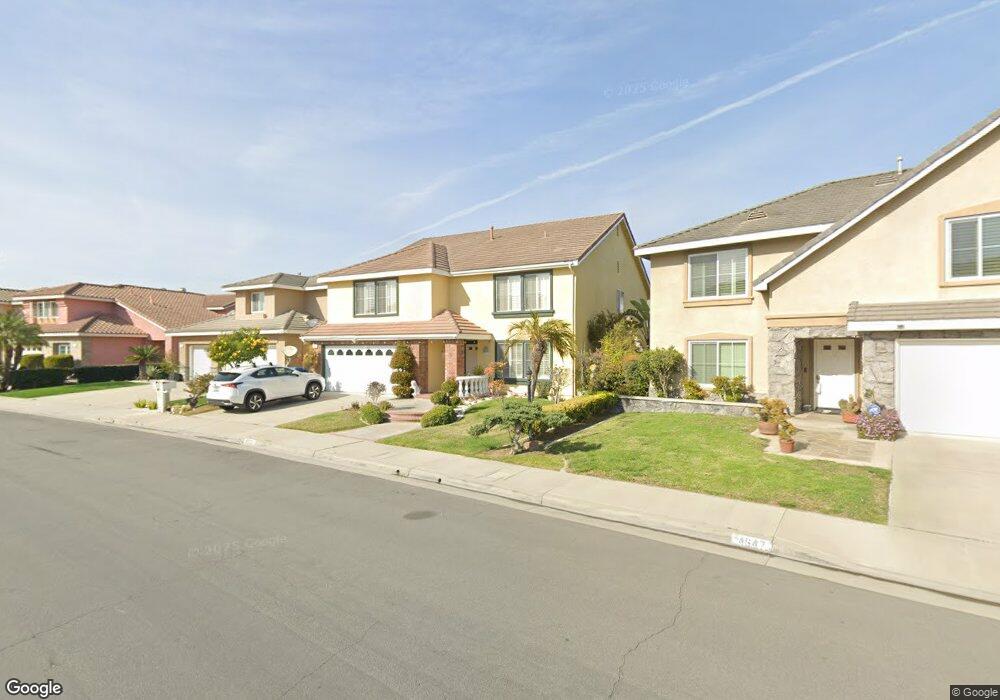
4639 Tuscani Dr Cypress, CA 90630
Estimated Value: $1,751,000 - $2,015,000
4
Beds
3
Baths
3,300
Sq Ft
$568/Sq Ft
Est. Value
About This Home
This home is located at 4639 Tuscani Dr, Cypress, CA 90630 and is currently estimated at $1,874,691, approximately $568 per square foot. 4639 Tuscani Dr is a home located in Orange County with nearby schools including Margaret Landell Elementary School, A.E. Arnold Elementary School, and Lexington Junior High School.
Ownership History
Date
Name
Owned For
Owner Type
Purchase Details
Closed on
Dec 15, 2023
Sold by
Bui Liem V and Bui Mai P
Bought by
Bui Family Trust and Bui
Current Estimated Value
Purchase Details
Closed on
May 31, 2002
Sold by
Suykry Kiriwath and Suykry Karen
Bought by
Bui Liem V and Bui Mai P
Home Financials for this Owner
Home Financials are based on the most recent Mortgage that was taken out on this home.
Original Mortgage
$428,400
Interest Rate
5.99%
Purchase Details
Closed on
Jan 4, 1996
Sold by
Cypress Homes Inc
Bought by
Suykry Kiriwath and Suykry Karen
Home Financials for this Owner
Home Financials are based on the most recent Mortgage that was taken out on this home.
Original Mortgage
$249,550
Interest Rate
7.04%
Create a Home Valuation Report for This Property
The Home Valuation Report is an in-depth analysis detailing your home's value as well as a comparison with similar homes in the area
Home Values in the Area
Average Home Value in this Area
Purchase History
| Date | Buyer | Sale Price | Title Company |
|---|---|---|---|
| Bui Family Trust | -- | None Listed On Document | |
| Bui Liem V | -- | None Listed On Document | |
| Bui Liem V | $612,000 | -- | |
| Suykry Kiriwath | $312,000 | First American Title Ins |
Source: Public Records
Mortgage History
| Date | Status | Borrower | Loan Amount |
|---|---|---|---|
| Previous Owner | Bui Liem V | $428,400 | |
| Previous Owner | Suykry Kiriwath | $249,550 |
Source: Public Records
Tax History Compared to Growth
Tax History
| Year | Tax Paid | Tax Assessment Tax Assessment Total Assessment is a certain percentage of the fair market value that is determined by local assessors to be the total taxable value of land and additions on the property. | Land | Improvement |
|---|---|---|---|---|
| 2025 | $9,751 | $886,373 | $482,887 | $403,486 |
| 2024 | $9,751 | $868,994 | $473,419 | $395,575 |
| 2023 | $9,531 | $851,955 | $464,136 | $387,819 |
| 2022 | $9,424 | $835,250 | $455,035 | $380,215 |
| 2021 | $9,299 | $818,873 | $446,113 | $372,760 |
| 2020 | $9,264 | $810,477 | $441,539 | $368,938 |
| 2019 | $8,997 | $794,586 | $432,882 | $361,704 |
| 2018 | $8,875 | $779,006 | $424,394 | $354,612 |
| 2017 | $8,566 | $763,732 | $416,073 | $347,659 |
| 2016 | $8,494 | $748,757 | $407,914 | $340,843 |
| 2015 | $8,434 | $737,510 | $401,786 | $335,724 |
| 2014 | $9,269 | $723,064 | $393,916 | $329,148 |
Source: Public Records
Map
Nearby Homes
- 4644 Portofino Cir
- 4790 Montefino Dr
- 9574 Tivoli Cir
- 4777 Larwin Ave
- 4671 Myra Ave
- 4326 Via Verde
- 4418 Larwin Ave
- 5000 Clementine Ln
- 9824 Via Sonoma
- 6007 Clementine Ln Unit 21
- 4177 Elizabeth Ct
- 5041 Myra Ave
- Plan B1X at Citrus Square - Cerise
- Plan B1 at Citrus Square - Cerise
- Plan A1 at Citrus Square - Cerise
- Plan A2 at Citrus Square - Cerise
- 9011 Cerise Ln Unit 121
- 9011 Cerise Ln
- 9011 Cerise Ln Unit 122
- 10191 Virgil Cir
- 4647 Tuscani Dr
- 4631 Tuscani Dr
- 4642 Amalfi St
- 4655 Tuscani Dr
- 4623 Tuscani Dr
- 4632 Amalfi St
- 4652 Amalfi St
- 4622 Amalfi St
- 4644 Tuscani Dr
- 4663 Tuscani Dr
- 4615 Tuscani Dr
- 4652 Tuscani Dr
- 4662 Amalfi St
- 4636 Tuscani Dr
- 4660 Tuscani Dr
- 4628 Tuscani Dr
- 9739 Ortano Ln
- 4672 Amalfi St
- 4671 Tuscani Dr
- 4607 Tuscani Dr