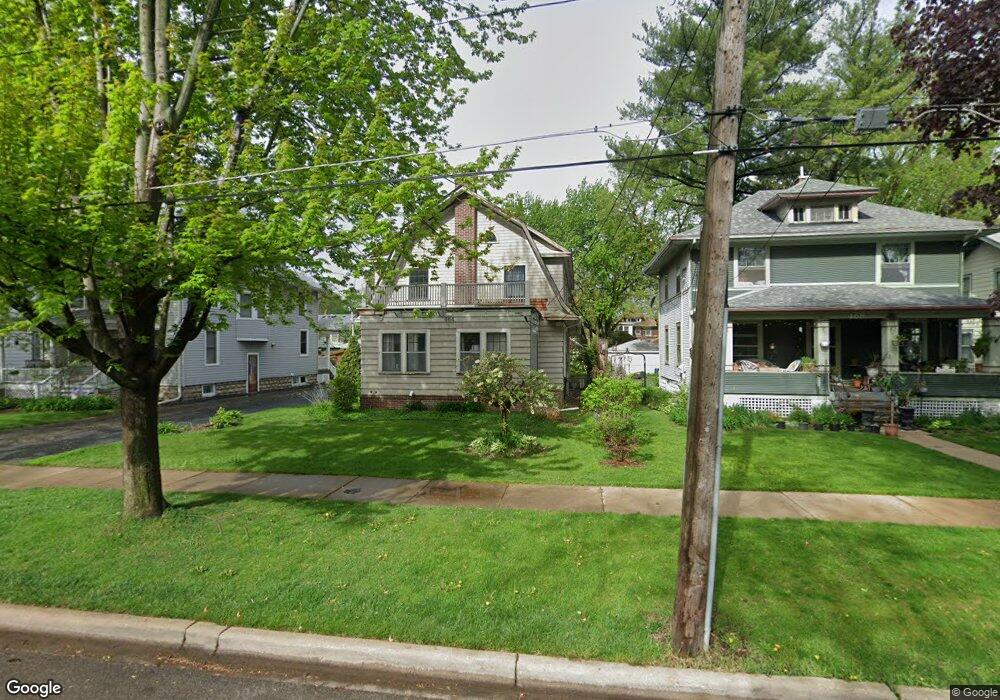
464 Palace St Aurora, IL 60506
Near West Galena NeighborhoodEstimated Value: $288,000 - $369,000
3
Beds
2
Baths
2,398
Sq Ft
$133/Sq Ft
Est. Value
About This Home
This home is located at 464 Palace St, Aurora, IL 60506 and is currently estimated at $319,620, approximately $133 per square foot. 464 Palace St is a home located in Kane County with nearby schools including Greenman Elementary School, Washington Middle School, and West Aurora High School.
Ownership History
Date
Name
Owned For
Owner Type
Purchase Details
Closed on
Nov 28, 2000
Sold by
Granoff Suzanne R
Bought by
Johnson Michael D
Current Estimated Value
Home Financials for this Owner
Home Financials are based on the most recent Mortgage that was taken out on this home.
Original Mortgage
$127,187
Outstanding Balance
$46,870
Interest Rate
7.7%
Mortgage Type
FHA
Estimated Equity
$272,750
Create a Home Valuation Report for This Property
The Home Valuation Report is an in-depth analysis detailing your home's value as well as a comparison with similar homes in the area
Home Values in the Area
Average Home Value in this Area
Purchase History
| Date | Buyer | Sale Price | Title Company |
|---|---|---|---|
| Johnson Michael D | $135,000 | Chicago Title Insurance Co |
Source: Public Records
Mortgage History
| Date | Status | Borrower | Loan Amount |
|---|---|---|---|
| Open | Johnson Michael D | $127,187 |
Source: Public Records
Tax History
| Year | Tax Paid | Tax Assessment Tax Assessment Total Assessment is a certain percentage of the fair market value that is determined by local assessors to be the total taxable value of land and additions on the property. | Land | Improvement |
|---|---|---|---|---|
| 2024 | $7,113 | $97,831 | $6,935 | $90,896 |
| 2023 | $6,438 | $87,411 | $6,196 | $81,215 |
| 2022 | $6,137 | $79,203 | $5,653 | $73,550 |
| 2021 | $6,016 | $75,453 | $5,263 | $70,190 |
| 2020 | $5,686 | $70,085 | $4,889 | $65,196 |
| 2019 | $5,460 | $61,833 | $4,530 | $57,303 |
| 2018 | $5,307 | $59,158 | $4,190 | $54,968 |
| 2017 | $4,923 | $53,830 | $3,861 | $49,969 |
| 2016 | $4,909 | $51,738 | $3,310 | $48,428 |
| 2015 | -- | $46,864 | $2,846 | $44,018 |
| 2014 | -- | $43,706 | $2,616 | $41,090 |
| 2013 | -- | $44,414 | $2,682 | $41,732 |
Source: Public Records
Map
Nearby Homes
- 357 W Park Ave
- 231-233 Williams St
- 371 Cedar St
- 415 Blackhawk St
- 519 N View St
- 418 W Illinois Ave
- 469 N Lake St
- 479 N Lake St
- 507 W Park Ave
- 20-22 N Locust St
- 603 N May St
- 359 W Galena Blvd
- 256 W Downer Place
- 932 W New York St
- 14-18 N Lake St
- 450 W Downer Place Unit 4C
- 138 Woodlawn Ave
- 160 S River St Unit 211
- 424 N Lancaster Ave
- 659 W Downer Place
Your Personal Tour Guide
Ask me questions while you tour the home.