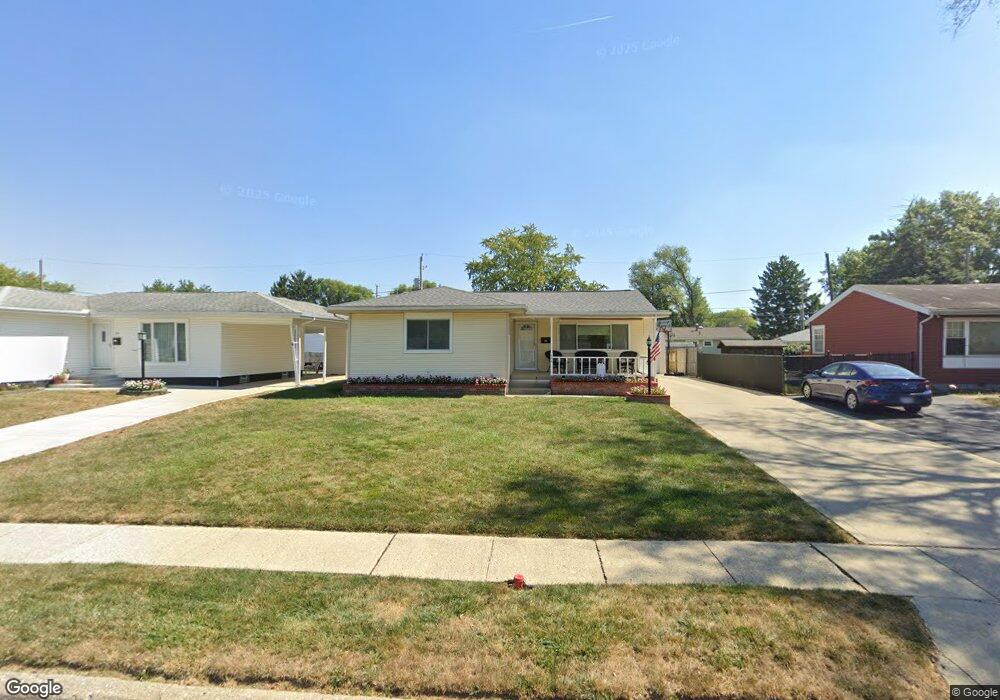
464 Ross Rd Columbus, OH 43213
Estimated Value: $215,000 - $239,000
3
Beds
2
Baths
1,140
Sq Ft
$200/Sq Ft
Est. Value
About This Home
This home is located at 464 Ross Rd, Columbus, OH 43213 and is currently estimated at $228,076, approximately $200 per square foot. 464 Ross Rd is a home located in Franklin County with nearby schools including Etna Road Elementary School, Beechwood Elementary School, and Rosemore Middle School.
Ownership History
Date
Name
Owned For
Owner Type
Purchase Details
Closed on
Sep 17, 2004
Sold by
Tindall Kevin L and Tindall Christina L
Bought by
Dean Joseph A and Dean Mercedes
Current Estimated Value
Home Financials for this Owner
Home Financials are based on the most recent Mortgage that was taken out on this home.
Original Mortgage
$107,500
Interest Rate
5.28%
Mortgage Type
Purchase Money Mortgage
Purchase Details
Closed on
Jul 17, 2002
Sold by
Ann Greismer Judith A and Ann Judith
Bought by
Tindall Thomas and Tindall Christina K
Home Financials for this Owner
Home Financials are based on the most recent Mortgage that was taken out on this home.
Original Mortgage
$108,300
Interest Rate
6.83%
Mortgage Type
Purchase Money Mortgage
Purchase Details
Closed on
Aug 31, 1994
Sold by
Brown Virgil L
Bought by
Judith Ann Greismer
Home Financials for this Owner
Home Financials are based on the most recent Mortgage that was taken out on this home.
Original Mortgage
$66,650
Interest Rate
5.75%
Mortgage Type
New Conventional
Create a Home Valuation Report for This Property
The Home Valuation Report is an in-depth analysis detailing your home's value as well as a comparison with similar homes in the area
Home Values in the Area
Average Home Value in this Area
Purchase History
| Date | Buyer | Sale Price | Title Company |
|---|---|---|---|
| Dean Joseph A | $126,500 | -- | |
| Tindall Thomas | $114,000 | Foundation Title Agency Inc | |
| Judith Ann Greismer | $88,900 | -- |
Source: Public Records
Mortgage History
| Date | Status | Borrower | Loan Amount |
|---|---|---|---|
| Closed | Dean Joseph A | $107,500 | |
| Closed | Tindall Thomas | $108,300 | |
| Closed | Judith Ann Greismer | $66,650 |
Source: Public Records
Tax History Compared to Growth
Tax History
| Year | Tax Paid | Tax Assessment Tax Assessment Total Assessment is a certain percentage of the fair market value that is determined by local assessors to be the total taxable value of land and additions on the property. | Land | Improvement |
|---|---|---|---|---|
| 2024 | $2,963 | $67,770 | $14,180 | $53,590 |
| 2023 | $2,941 | $67,760 | $14,175 | $53,585 |
| 2022 | $2,267 | $39,690 | $6,230 | $33,460 |
| 2021 | $2,129 | $39,690 | $6,230 | $33,460 |
| 2020 | $2,128 | $40,080 | $6,230 | $33,850 |
| 2019 | $1,924 | $31,510 | $5,010 | $26,500 |
| 2018 | $2,243 | $31,510 | $5,010 | $26,500 |
| 2017 | $2,181 | $31,510 | $5,010 | $26,500 |
| 2016 | $2,504 | $38,330 | $5,080 | $33,250 |
| 2015 | $2,525 | $38,330 | $5,080 | $33,250 |
| 2014 | $2,525 | $38,330 | $5,080 | $33,250 |
| 2013 | $1,335 | $42,595 | $5,635 | $36,960 |
Source: Public Records
Map
Nearby Homes
- 451 Beaver Ave
- 571 S Hamilton Rd
- 4489 Saint Margaret Ln
- 4653 Kae Ave
- 353 Shell Ct E
- 579 Westphal Ave
- 469 Cumberland Dr
- 4780 Etna Rd Unit 782
- 4368 Broadhurst Dr
- 4662 Jae Ave
- 424 Cumberland Dr
- 547 Country Club Rd
- 4232 Mayflower Blvd
- 4148 Elbern Ave
- 322 Fairway Cir
- 798 S Yearling Rd
- 1085 S Hamilton Rd
- 963 Erickson Ave
- 4094 E Main St
- 4144 Mcallister Ave