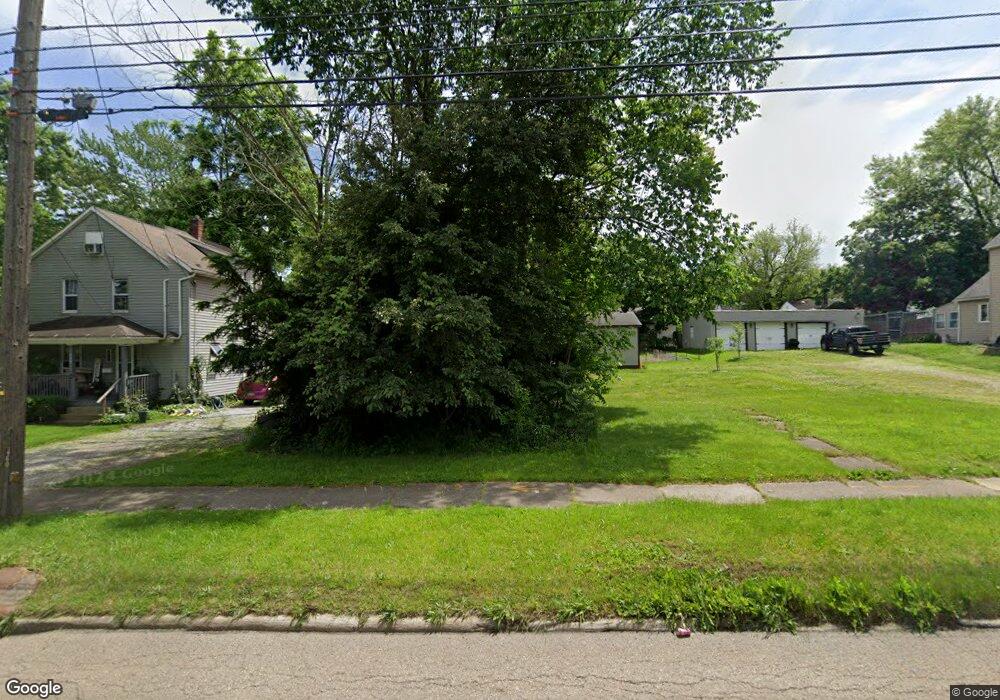
464 W Wilbeth Rd Akron, OH 44314
Kenmore NeighborhoodEstimated Value: $46,000 - $88,000
1
Bed
1
Bath
481
Sq Ft
$129/Sq Ft
Est. Value
About This Home
This home is located at 464 W Wilbeth Rd, Akron, OH 44314 and is currently estimated at $62,127, approximately $129 per square foot. 464 W Wilbeth Rd is a home located in Summit County with nearby schools including Kenmore Garfield Community Learning Center and Sam Salem Community Learning Center.
Ownership History
Date
Name
Owned For
Owner Type
Purchase Details
Closed on
Oct 2, 2019
Sold by
Smallwood Jennifer V and Hammon Russell G
Bought by
Smallwood Tiffany R
Current Estimated Value
Purchase Details
Closed on
May 13, 2011
Sold by
Fannie Mae
Bought by
Smallwood Jennifer
Purchase Details
Closed on
Mar 8, 2011
Sold by
Fannie Mae
Bought by
Smallwood Jennifer
Purchase Details
Closed on
Nov 10, 2010
Sold by
Cameron Cindy
Bought by
Federal National Mortgage Association
Purchase Details
Closed on
Nov 16, 2005
Sold by
Young Bonnie R and Young Thomas W
Bought by
Cameron Cindy
Home Financials for this Owner
Home Financials are based on the most recent Mortgage that was taken out on this home.
Original Mortgage
$24,000
Interest Rate
6.13%
Mortgage Type
Fannie Mae Freddie Mac
Create a Home Valuation Report for This Property
The Home Valuation Report is an in-depth analysis detailing your home's value as well as a comparison with similar homes in the area
Home Values in the Area
Average Home Value in this Area
Purchase History
| Date | Buyer | Sale Price | Title Company |
|---|---|---|---|
| Smallwood Tiffany R | -- | None Available | |
| Smallwood Jennifer | -- | None Available | |
| Smallwood Jennifer | $4,600 | Accutitle Agency Inc | |
| Federal National Mortgage Association | $16,000 | None Available | |
| Cameron Cindy | $24,000 | Buckeye Reserve Title Agency |
Source: Public Records
Mortgage History
| Date | Status | Borrower | Loan Amount |
|---|---|---|---|
| Previous Owner | Cameron Cindy | $24,000 |
Source: Public Records
Tax History
| Year | Tax Paid | Tax Assessment Tax Assessment Total Assessment is a certain percentage of the fair market value that is determined by local assessors to be the total taxable value of land and additions on the property. | Land | Improvement |
|---|---|---|---|---|
| 2025 | $26,885 | $19,125 | $7,837 | $11,288 |
| 2024 | $3,593 | $19,125 | $7,837 | $11,288 |
| 2023 | $26,885 | $19,125 | $7,837 | $11,288 |
| 2022 | $1,109 | $11,761 | $4,778 | $6,983 |
| 2021 | $1,010 | $11,761 | $4,778 | $6,983 |
| 2020 | $1,098 | $11,760 | $4,780 | $6,980 |
| 2019 | $883 | $9,100 | $4,440 | $4,660 |
| 2018 | $974 | $9,100 | $4,440 | $4,660 |
| 2017 | $1,204 | $9,100 | $4,440 | $4,660 |
| 2016 | $965 | $9,790 | $4,780 | $5,010 |
| 2015 | $1,204 | $9,790 | $4,780 | $5,010 |
| 2014 | $1,190 | $9,790 | $4,780 | $5,010 |
| 2013 | $1,175 | $13,070 | $4,780 | $8,290 |
Source: Public Records
Map
Nearby Homes
- 575 Flora Ave
- 2275 Edwin Ave
- 590 Flora Ave
- 595 Flora Ave
- 2255 Nesmith Lake Blvd
- 636 Flora Ave
- 2271 5th St SW
- 2286 6th St SW
- 2256 Maryland Ave
- 364 Rexford St
- 2407 Nesmith Lake Blvd
- 2462 Edwin Ave
- 2125 7th St SW
- 2291 11th St SW
- 1909 2nd St SW
- 2351 13th St SW
- 2125 10th St SW
- 2240 12th St SW
- 1887 Ritzman Ct
- 75 W Dartmore Ave
- 460 W Wilbeth Rd
- 468 W Wilbeth Rd
- 476 W Wilbeth Rd
- 476 W Wilbeth Rd
- 450 W Wilbeth Rd
- 463 Flora Ave
- 459 Flora Ave
- 467 Flora Ave
- 471 Flora Ave
- 455 Flora Ave
- 446 W Wilbeth Rd
- 444 W Wilbeth Rd
- 451 Flora Ave
- 475 Flora Ave
- 484 W Wilbeth Rd
- 442 W Wilbeth Rd
- 447 Flora Ave
- 479 Flora Ave
- 488 W Wilbeth Rd
- 443 Flora Ave
Your Personal Tour Guide
Ask me questions while you tour the home.