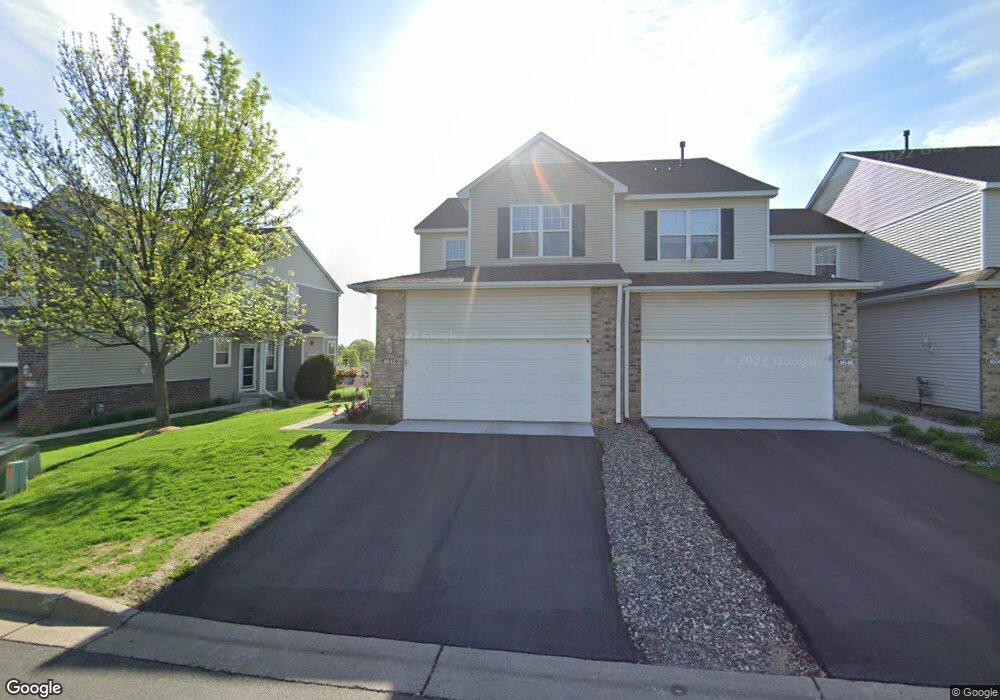
4642 Blaylock Way Unit 3501 Inver Grove Heights, MN 55076
Estimated Value: $358,072 - $433,000
2
Beds
4
Baths
1,722
Sq Ft
$223/Sq Ft
Est. Value
About This Home
This home is located at 4642 Blaylock Way Unit 3501, Inver Grove Heights, MN 55076 and is currently estimated at $383,268, approximately $222 per square foot. 4642 Blaylock Way Unit 3501 is a home located in Dakota County with nearby schools including Hilltop Elementary School, Inver Grove Heights Middle School, and Simley Senior High School.
Ownership History
Date
Name
Owned For
Owner Type
Purchase Details
Closed on
Jun 5, 2019
Sold by
Archibald Brandon L and Archibald Janet M
Bought by
Lewis Krystle
Current Estimated Value
Home Financials for this Owner
Home Financials are based on the most recent Mortgage that was taken out on this home.
Original Mortgage
$247,410
Outstanding Balance
$217,534
Interest Rate
4.1%
Mortgage Type
New Conventional
Estimated Equity
$165,734
Purchase Details
Closed on
Jul 31, 2007
Sold by
Mueller Christopher L and Mueller Kimberly A
Bought by
Archibald Brandon L and Archibald Janet M
Purchase Details
Closed on
May 4, 2004
Sold by
Centex Homes Minnesota Division
Bought by
Mueller Christopher and Mueller Kimberly
Create a Home Valuation Report for This Property
The Home Valuation Report is an in-depth analysis detailing your home's value as well as a comparison with similar homes in the area
Home Values in the Area
Average Home Value in this Area
Purchase History
| Date | Buyer | Sale Price | Title Company |
|---|---|---|---|
| Lewis Krystle | $274,900 | On Site Title Llc | |
| Archibald Brandon L | $265,000 | -- | |
| Mueller Christopher | -- | -- |
Source: Public Records
Mortgage History
| Date | Status | Borrower | Loan Amount |
|---|---|---|---|
| Open | Lewis Krystle | $247,410 |
Source: Public Records
Tax History Compared to Growth
Tax History
| Year | Tax Paid | Tax Assessment Tax Assessment Total Assessment is a certain percentage of the fair market value that is determined by local assessors to be the total taxable value of land and additions on the property. | Land | Improvement |
|---|---|---|---|---|
| 2024 | $3,444 | $322,300 | $53,300 | $269,000 |
| 2023 | $3,444 | $339,200 | $53,600 | $285,600 |
| 2022 | $3,448 | $338,600 | $53,600 | $285,000 |
| 2021 | $3,092 | $317,000 | $46,600 | $270,400 |
| 2020 | $2,886 | $282,800 | $44,400 | $238,400 |
| 2019 | $2,885 | $265,200 | $42,300 | $222,900 |
| 2018 | $2,704 | $248,700 | $39,100 | $209,600 |
| 2017 | $2,732 | $233,100 | $36,200 | $196,900 |
| 2016 | $2,622 | $230,100 | $34,500 | $195,600 |
| 2015 | $2,571 | $205,067 | $30,257 | $174,810 |
| 2014 | -- | $190,570 | $27,537 | $163,033 |
| 2013 | -- | $166,590 | $24,855 | $141,735 |
Source: Public Records
Map
Nearby Homes
- 4611 Blaine Ave Unit 1308
- 4614 Bloomberg Ln
- 4552 Blaylock Way
- 4745 Blaine Ave Unit 509
- 4852 Bisset Ln Unit 9504
- 210 19th Ave S
- 354 12th Ave S
- 4815 Babcock Trail Unit 3010
- 4825 Babcock Trail Unit 2005
- 456 10th Ave S
- 450 10th Ave S
- 308 10th Ave S
- 2233 Gilbert Ln
- 140 12th Ave S
- 1706 2nd St N
- 507 8th Ave S
- 804 8th Ave S
- 101 11th Ave N
- 118 11th Ave N
- 137 9th Ave S
- 4642 Blaylock Way
- 4634 Blaylock Way
- 4634 Blaylock Way Unit 3604
- 4654 Blaylock Way
- 4626 Blaylock Way
- 4599 Bloomberg Ln
- 4663 4663 Blaylock--
- 4623 4623 Blaylock-Way-
- 4623 4623 Blaylock Way
- 4640 Blaine Ave
- 4576 Blaylock Cir
- 4709 Blaylock Way Unit 2804
- 4592 Blaylock Cir
- 4614 Blaylock Way
- 4681 Blaylock Way
- 4610 Blaylock Way
- 4674 Blaine Ave Unit 1703
- 4685 Blaylock Way
- 4602 Blaylock Way
- 4678 Blaine Ave Unit 1701