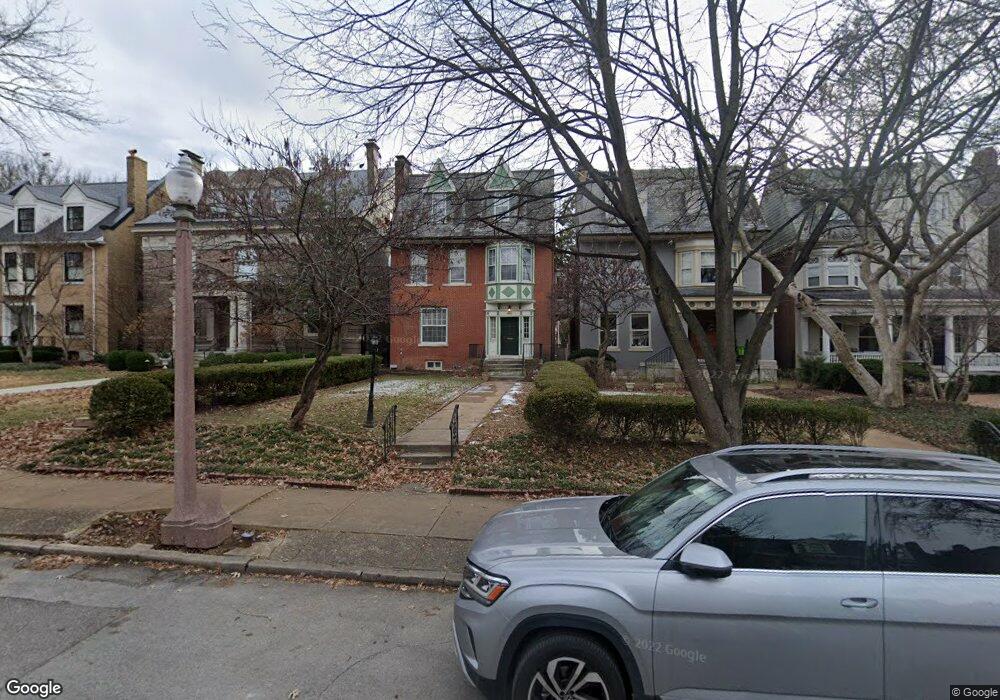
4642 Pershing Place Saint Louis, MO 63108
Central West End NeighborhoodEstimated Value: $732,000 - $821,000
--
Bed
4
Baths
3,714
Sq Ft
$211/Sq Ft
Est. Value
About This Home
This home is located at 4642 Pershing Place, Saint Louis, MO 63108 and is currently estimated at $782,943, approximately $210 per square foot. 4642 Pershing Place is a home located in St. Louis City with nearby schools including Adams Elementary School, Roosevelt High School, and The Biome.
Ownership History
Date
Name
Owned For
Owner Type
Purchase Details
Closed on
Jun 6, 2019
Sold by
Smith Timothy William and Jorgensen Miriam Ruth
Bought by
Smith Timothy William and Jorgensen Miriam Ruth
Current Estimated Value
Purchase Details
Closed on
Oct 29, 2001
Sold by
Welty Andrew M and Welty Ann M
Bought by
Smith Timothy W and Jorzensen Miriam R
Home Financials for this Owner
Home Financials are based on the most recent Mortgage that was taken out on this home.
Original Mortgage
$487,500
Outstanding Balance
$168,036
Interest Rate
5.12%
Mortgage Type
Purchase Money Mortgage
Estimated Equity
$614,907
Purchase Details
Closed on
Jul 24, 1998
Sold by
Konet Kenneth and Konet Regina
Bought by
Welty Andrew M and Welty Ann M
Home Financials for this Owner
Home Financials are based on the most recent Mortgage that was taken out on this home.
Original Mortgage
$200,000
Interest Rate
6.94%
Mortgage Type
Purchase Money Mortgage
Purchase Details
Closed on
Jan 8, 1998
Sold by
Coco Charles E and Coco Katherine K
Bought by
Konet Kenneth and Konet Regina
Create a Home Valuation Report for This Property
The Home Valuation Report is an in-depth analysis detailing your home's value as well as a comparison with similar homes in the area
Home Values in the Area
Average Home Value in this Area
Purchase History
| Date | Buyer | Sale Price | Title Company |
|---|---|---|---|
| Smith Timothy William | -- | None Available | |
| Smith Timothy W | -- | -- | |
| Welty Andrew M | -- | -- | |
| Konet Kenneth | -- | -- |
Source: Public Records
Mortgage History
| Date | Status | Borrower | Loan Amount |
|---|---|---|---|
| Open | Smith Timothy W | $487,500 | |
| Previous Owner | Welty Andrew M | $200,000 |
Source: Public Records
Tax History Compared to Growth
Tax History
| Year | Tax Paid | Tax Assessment Tax Assessment Total Assessment is a certain percentage of the fair market value that is determined by local assessors to be the total taxable value of land and additions on the property. | Land | Improvement |
|---|---|---|---|---|
| 2025 | $11,660 | $132,880 | $6,610 | $126,270 |
| 2024 | $11,129 | $126,870 | $6,610 | $120,260 |
| 2023 | $11,129 | $126,870 | $6,610 | $120,260 |
| 2022 | $10,967 | $120,060 | $6,610 | $113,450 |
| 2021 | $10,953 | $120,060 | $6,610 | $113,450 |
| 2020 | $10,619 | $117,150 | $6,610 | $110,540 |
| 2019 | $10,585 | $117,150 | $6,610 | $110,540 |
| 2018 | $9,429 | $126,370 | $6,610 | $119,760 |
| 2017 | $9,200 | $102,010 | $6,610 | $95,400 |
| 2016 | $8,798 | $95,000 | $6,610 | $88,390 |
| 2015 | $8,027 | $95,000 | $6,610 | $88,390 |
| 2014 | $7,801 | $124,180 | $6,610 | $117,570 |
| 2013 | -- | $92,150 | $6,610 | $85,540 |
Source: Public Records
Map
Nearby Homes
- 4512 Pershing Place
- 4545 Lindell Blvd Unit 14
- 4545 Lindell Blvd Unit 10
- 377 N Taylor Ave Unit 1S
- 4530 Mcpherson Ave Unit 1E
- 4530 Mcpherson Ave Unit 2E
- 4738 Mcpherson Ave Unit 201
- 4512 Mcpherson Ave Unit 1W
- 4540 Lindell Blvd Unit 102
- 4462 Mcpherson Ave Unit 3A
- 4701 Westminster Place
- 4480 Maryland Ave
- 4465 Pershing Ave Unit B
- 4924 Mcpherson Ave
- 4969 Pershing Place Unit 1
- 232 N Kingshighway Blvd Unit 907
- 232 N Kingshighway Blvd Unit 1407
- 232 N Kingshighway Blvd Unit 2201
- 4954 Lindell Blvd Unit 6-E
- 429 N Euclid Ave
- 4646 Pershing Place
- 4638 Pershing Place
- 4650 Pershing Place
- 4632 Pershing Place
- 4654 Pershing Place
- 4628 Pershing Place
- 4624 Pershing Place
- 4664 Pershing Place
- 4629 Pershing Place
- 4623 Pershing Place
- 4633 Pershing Place
- 4620 Pershing Place
- 4619 Pershing Place
- 4637 Pershing Place
- 4668 Pershing Place
- 4639 Maryland Ave
- 4615 Pershing Place
- 4643 Pershing Place
- 4635 Maryland Ave
- 4616 Pershing Place