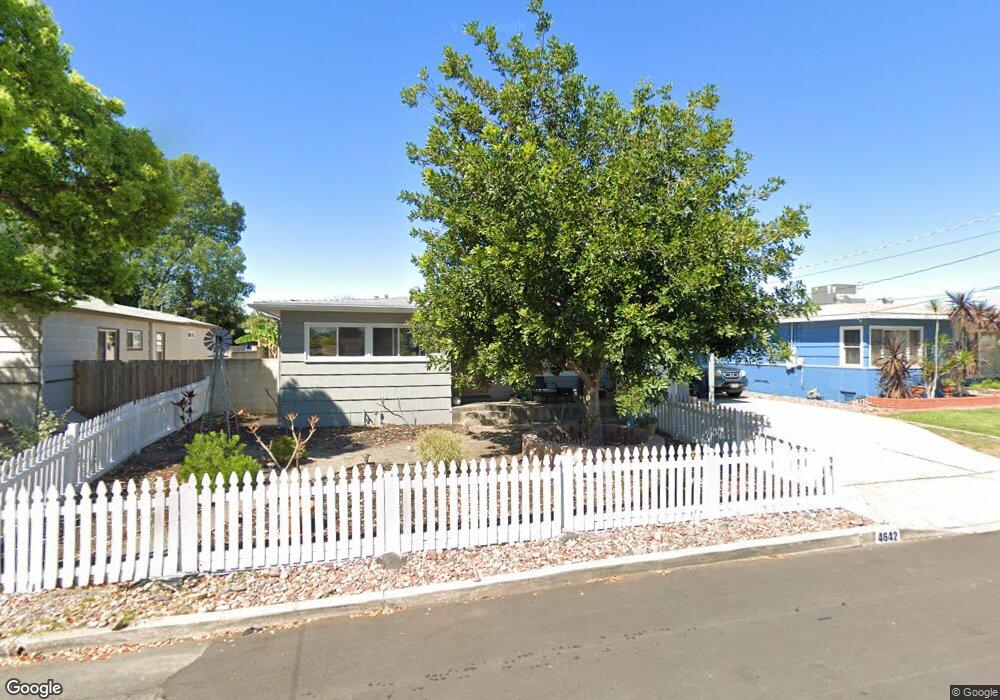
4642 Terry Ln La Mesa, CA 91942
La Mesa AreaEstimated Value: $731,000 - $835,000
About This Home
This home is located at 4642 Terry Ln, La Mesa, CA 91942 and is currently estimated at $796,884, approximately $666 per square foot. 4642 Terry Ln is a home located in San Diego County with nearby schools including Rolando Elementary School, La Mesa Arts Academy, and Mount Miguel High School.
Ownership History
We collect this data history from publicly available records. To have your information removed, we recommend requesting removal directly through your county’s website.
Purchase Details
Home Financials for this Owner
Home Financials are based on the most recent Mortgage that was taken out on this home.Purchase Details
Home Financials for this Owner
Home Financials are based on the most recent Mortgage that was taken out on this home.Purchase Details
Home Financials for this Owner
Home Financials are based on the most recent Mortgage that was taken out on this home.Purchase Details
Purchase Details
Home Financials for this Owner
Home Financials are based on the most recent Mortgage that was taken out on this home.Purchase Details
Purchase Details
Purchase Details
Home Financials for this Owner
Home Financials are based on the most recent Mortgage that was taken out on this home.Purchase Details
Purchase Details
Home Financials for this Owner
Home Financials are based on the most recent Mortgage that was taken out on this home.Purchase Details
Home Financials for this Owner
Home Financials are based on the most recent Mortgage that was taken out on this home.Purchase Details
Purchase Details
Purchase History
We collect this data history from publicly available records. To have your information removed, we recommend requesting removal directly through your county’s website.
| Date | Buyer | Sale Price | Title Company |
|---|---|---|---|
| -- | Wfg Title Company Of Ca | ||
| -- | Title 365 | ||
| -- | Accommodation | ||
| -- | Lsi Title Company | ||
| -- | Accommodation | ||
| -- | None Available | ||
| $320,500 | Chicago Title Company | ||
| $411,392 | None Available | ||
| -- | None Available | ||
| $565,000 | Fidelity National Title San | ||
| -- | Alliance Title Company | ||
| $460,000 | Alliance Title Company | ||
| $215,000 | Old Republic Title Company | ||
| $137,500 | Chicago Title Co | ||
| $139,000 | South Coast Title Co |
Mortgage History
We collect this data history from publicly available records. To have your information removed, we recommend requesting removal directly through your county’s website.
| Date | Status | Borrower | Loan Amount |
|---|---|---|---|
| Open | $189,400 | ||
| Open | $540,000 | ||
| Closed | $457,000 | ||
| Closed | $457,000 | ||
| Closed | $395,000 | ||
| Closed | $312,000 | ||
| Closed | $316,972 | ||
| Closed | $322,190 | ||
| Closed | $320,524 | ||
| Closed | $315,788 | ||
| Previous Owner | $113,000 | ||
| Previous Owner | $452,000 | ||
| Previous Owner | $368,000 | ||
| Previous Owner | $53,000 | ||
| Previous Owner | $32,000 | ||
| Previous Owner | $220,000 | ||
| Previous Owner | $115,000 | ||
| Previous Owner | $105,000 | ||
| Previous Owner | $21,195 | ||
| Previous Owner | $60,000 |
Tax History
We collect this data history from publicly available records. To have your information removed, we recommend requesting removal directly through your county’s website.
| Year | Tax Paid | Tax Assessment Tax Assessment Total Assessment is a certain percentage of the fair market value that is determined by local assessors to be the total taxable value of land and additions on the property. | Land | Improvement |
|---|---|---|---|---|
| 2025 | $5,369 | $412,387 | $270,420 | $141,967 |
| 2024 | $5,369 | $404,302 | $265,118 | $139,184 |
| 2023 | $5,192 | $396,375 | $259,920 | $136,455 |
| 2022 | $5,109 | $388,604 | $254,824 | $133,780 |
| 2021 | $5,022 | $380,985 | $249,828 | $131,157 |
| 2020 | $4,857 | $377,080 | $247,267 | $129,813 |
| 2019 | $4,751 | $369,687 | $242,419 | $127,268 |
| 2018 | $4,642 | $362,439 | $237,666 | $124,773 |
| 2017 | $8,646 | $355,333 | $233,006 | $122,327 |
| 2016 | $4,407 | $348,367 | $228,438 | $119,929 |
| 2015 | $4,380 | $343,135 | $225,007 | $118,128 |
| 2014 | $4,306 | $336,415 | $220,600 | $115,815 |
Map
- 4580 Terry Ln
- 6979 Tower St
- 4750 70th St Unit 58
- 6749 Alamo Ct
- 4850 69th Place
- 4844 68th St Unit 3
- 6705 Rolando Knolls Dr
- 6735 Amherst St Unit 5
- 7105 Amherst St
- 4927 67th St
- 6650 Amherst St Unit 18C
- 4235 Francis Way
- 4725 Filipo St
- 7212 Colony Rd
- 4779 Harbinson Ave
- 4789 Harbinson Ave
- 4824 Rolando Blvd
- 7273 Cornell Ave
- 4775 Seminole Dr Unit 201
- 7292 W Point Ave
Ask me questions while you tour the home.