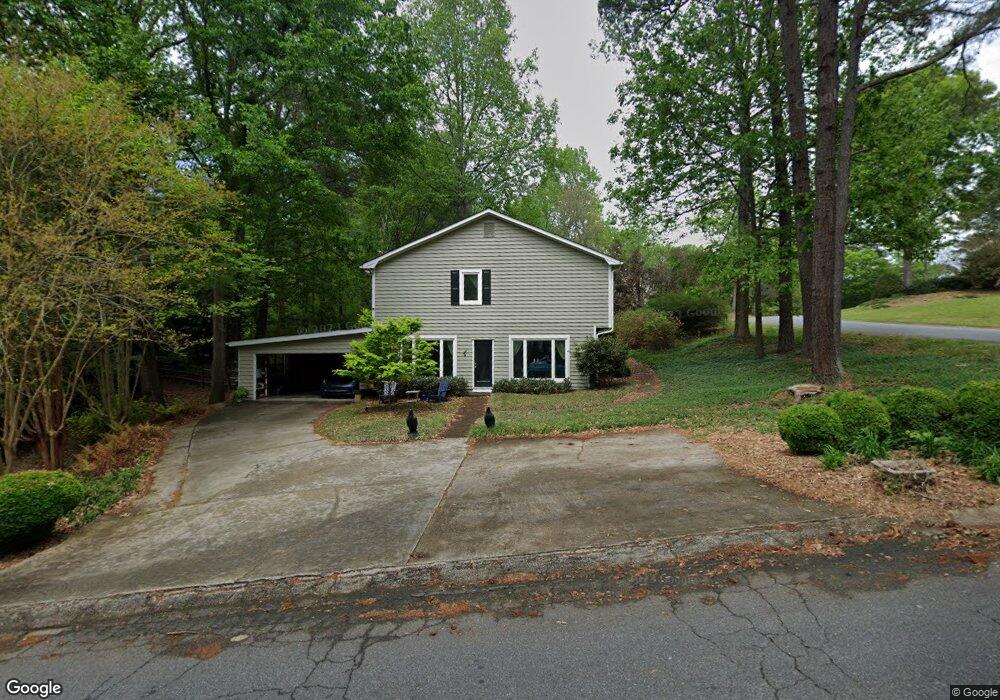
4643 Riveredge Dr Unit 4 Duluth, GA 30096
Estimated Value: $504,041 - $548,000
3
Beds
2
Baths
1,879
Sq Ft
$281/Sq Ft
Est. Value
About This Home
This home is located at 4643 Riveredge Dr Unit 4, Duluth, GA 30096 and is currently estimated at $527,510, approximately $280 per square foot. 4643 Riveredge Dr Unit 4 is a home located in Gwinnett County with nearby schools including Berkeley Lake Elementary School, Duluth Middle School, and Duluth High School.
Ownership History
Date
Name
Owned For
Owner Type
Purchase Details
Closed on
Mar 13, 2009
Sold by
Agustin Andrew
Bought by
Agustin Diedre
Current Estimated Value
Home Financials for this Owner
Home Financials are based on the most recent Mortgage that was taken out on this home.
Original Mortgage
$148,000
Outstanding Balance
$94,096
Interest Rate
5.29%
Mortgage Type
New Conventional
Estimated Equity
$433,414
Purchase Details
Closed on
May 31, 2001
Sold by
Cogan Daniel P and Cogan Dana J
Bought by
Agustin Andrew and Agustin Diedre
Home Financials for this Owner
Home Financials are based on the most recent Mortgage that was taken out on this home.
Original Mortgage
$158,400
Interest Rate
7.05%
Mortgage Type
New Conventional
Purchase Details
Closed on
May 31, 1995
Sold by
Hawkins Darlene Ann F
Bought by
Cogan Daniel P and Jordan Dana L
Create a Home Valuation Report for This Property
The Home Valuation Report is an in-depth analysis detailing your home's value as well as a comparison with similar homes in the area
Home Values in the Area
Average Home Value in this Area
Purchase History
| Date | Buyer | Sale Price | Title Company |
|---|---|---|---|
| Agustin Diedre | -- | -- | |
| Agustin Andrew | -- | -- | |
| Agustin Andrew | $198,000 | -- | |
| Cogan Daniel P | $106,400 | -- |
Source: Public Records
Mortgage History
| Date | Status | Borrower | Loan Amount |
|---|---|---|---|
| Open | Agustin Andrew | $148,000 | |
| Previous Owner | Agustin Andrew | $158,400 | |
| Closed | Cogan Daniel P | $0 |
Source: Public Records
Tax History
| Year | Tax Paid | Tax Assessment Tax Assessment Total Assessment is a certain percentage of the fair market value that is determined by local assessors to be the total taxable value of land and additions on the property. | Land | Improvement |
|---|---|---|---|---|
| 2025 | $4,363 | $179,200 | $41,600 | $137,600 |
| 2024 | $3,194 | $185,360 | $41,600 | $143,760 |
| 2023 | $3,194 | $116,480 | $28,800 | $87,680 |
| 2022 | $3,193 | $116,480 | $28,800 | $87,680 |
| 2021 | $3,267 | $127,240 | $28,800 | $98,440 |
| 2020 | $3,290 | $116,480 | $24,000 | $92,480 |
| 2019 | $3,234 | $116,480 | $24,000 | $92,480 |
| 2018 | $3,245 | $116,480 | $24,000 | $92,480 |
| 2016 | $2,694 | $92,840 | $22,000 | $70,840 |
| 2015 | $2,714 | $92,840 | $22,000 | $70,840 |
| 2014 | $2,179 | $74,280 | $22,000 | $52,280 |
Source: Public Records
Map
Nearby Homes
- 4719 Brownstone Dr
- 3621 Farmington Ln
- 3610 Mansions Pkwy
- 4819 Coppedge Trail
- 4500 River Mansions Trace
- 3511 Miller Farms Ln
- 3449 Grist Mill Ct NW
- 3460 Miller Farms Ln Unit 3
- 3507 Dunlin Shore Ct Unit 3
- 335 Marshy Pointe
- 3950 Ancroft Cir Unit 2B
- 195 High Bluff Ct
- 3875 Ancroft Cir
- 4026 Kingsley Park Ct
- 300 Chesterton Cir
- 5002 Riverthur Ct
- 175 High Bluff Ct
- 4218 River District Dr
- 40 Lakeshore Dr
- 4248 River District Dr
- 4653 Riveredge Dr Unit 1
- 3716 Foxwood Rd
- 4642 Riveredge Dr
- 3707 Foxwood Rd Unit 4
- 3726 Foxwood Rd
- 3697 Foxwood Rd
- 3737 Coldstream Ln
- 3747 Coldstream Ln
- 3717 Foxwood Rd
- 4652 Riveredge Dr
- 4654 Stonehenge Dr
- 3676 Foxwood Rd Unit 4
- 3687 Foxwood Rd
- 4546 Stonehenge D
- 4662 Riveredge Dr Unit 1
- 3677 Foxwood Rd
- 3748 Coldstream Ln
- 4664 Stonehenge Dr
- 3727 Foxwood Rd
- 4571 River Mansion Ct
Your Personal Tour Guide
Ask me questions while you tour the home.