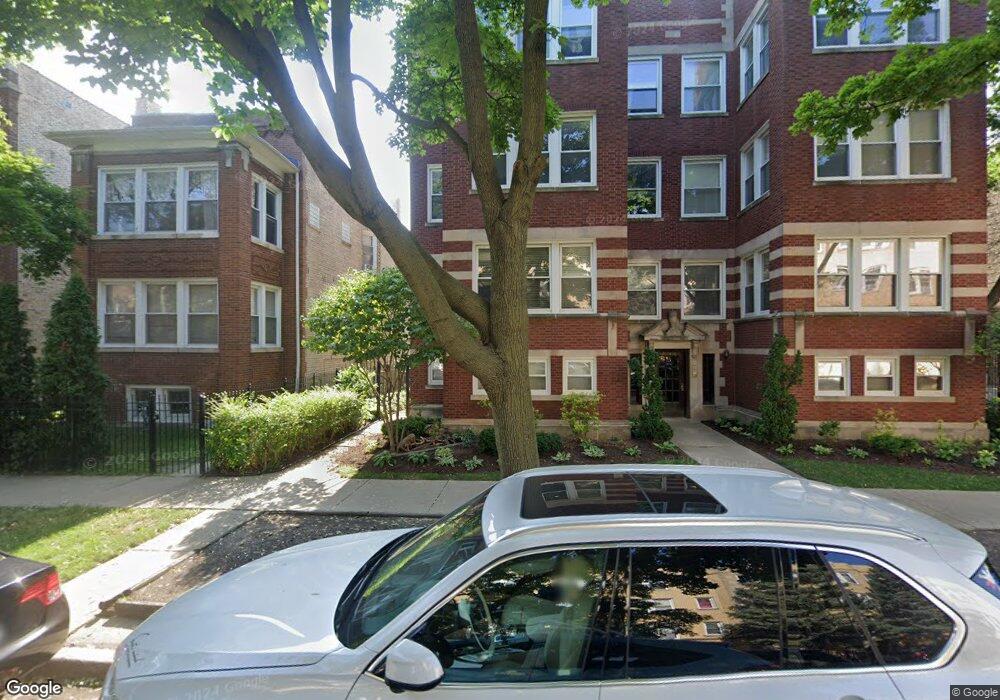
4644 N Central Park Ave Unit 46 Chicago, IL 60625
Albany Park NeighborhoodEstimated Value: $291,000 - $359,000
2
Beds
2
Baths
1,410
Sq Ft
$231/Sq Ft
Est. Value
About This Home
This home is located at 4644 N Central Park Ave Unit 46, Chicago, IL 60625 and is currently estimated at $325,525, approximately $230 per square foot. 4644 N Central Park Ave Unit 46 is a home located in Cook County with nearby schools including Haugan Elementary School, Roosevelt High School, and ASPIRA Haugan Middle School.
Ownership History
Date
Name
Owned For
Owner Type
Purchase Details
Closed on
Sep 1, 2017
Sold by
Ross Edward E and Ross Kathy
Bought by
Lovelace John and Lovelace Sylvia
Current Estimated Value
Purchase Details
Closed on
Jul 13, 2011
Sold by
Ross Edward
Bought by
Ross Edward E and Edward E Ross Living Trust
Purchase Details
Closed on
May 15, 2000
Sold by
Gr Development & Construction Inc
Bought by
Ross Edward E
Create a Home Valuation Report for This Property
The Home Valuation Report is an in-depth analysis detailing your home's value as well as a comparison with similar homes in the area
Home Values in the Area
Average Home Value in this Area
Purchase History
| Date | Buyer | Sale Price | Title Company |
|---|---|---|---|
| Lovelace John | $239,000 | Fidelity National Title | |
| Ross Edward E | -- | None Available | |
| Ross Edward E | $189,000 | -- |
Source: Public Records
Tax History Compared to Growth
Tax History
| Year | Tax Paid | Tax Assessment Tax Assessment Total Assessment is a certain percentage of the fair market value that is determined by local assessors to be the total taxable value of land and additions on the property. | Land | Improvement |
|---|---|---|---|---|
| 2024 | $5,175 | $25,422 | $4,397 | $21,025 |
| 2023 | $5,045 | $24,441 | $3,518 | $20,923 |
| 2022 | $5,045 | $24,441 | $3,518 | $20,923 |
| 2021 | $4,931 | $24,439 | $3,517 | $20,922 |
| 2020 | $4,768 | $21,328 | $1,821 | $19,507 |
| 2019 | $4,818 | $23,902 | $1,821 | $22,081 |
| 2018 | $4,737 | $23,902 | $1,821 | $22,081 |
| 2017 | $2,281 | $13,937 | $1,633 | $12,304 |
| 2016 | $2,299 | $13,937 | $1,633 | $12,304 |
| 2015 | $2,080 | $13,937 | $1,633 | $12,304 |
| 2014 | $3,424 | $20,957 | $1,507 | $19,450 |
| 2013 | $3,346 | $20,957 | $1,507 | $19,450 |
Source: Public Records
Map
Nearby Homes
- 4621 N Monticello Ave
- 4619 N Lawndale Ave Unit 1
- 4734 N Drake Ave
- 4534 N Saint Louis Ave
- 3711 W Lawrence Ave
- 4515 N Hamlin Ave
- 3733 W Sunnyside Ave
- 4426 N Drake Ave
- 3618 W Ainslie St Unit 3W
- 4903 N Monticello Ave Unit 3
- 4906 N Drake Ave Unit 3
- 4900 N Lawndale Ave Unit G
- 3550 W Montrose Ave Unit 107
- 4624 N Springfield Ave
- 4614 N Springfield Ave
- 4714 N Spaulding Ave
- 4602 N Springfield Ave
- 3816 W Montrose Ave
- 3849 W Ainslie St Unit 1
- 5007 N Lawndale Ave
- 4644 N Central Park Ave Unit 2
- 4644 N Central Park Ave Unit 46
- 4644 N Central Park Ave Unit 46
- 4644 N Central Park Ave Unit 46
- 4644 N Central Park Ave Unit 46
- 4644 N Central Park Ave Unit 1S
- 4646 N Central Park Ave Unit 46
- 4646 N Central Park Ave Unit 3
- 4646 N Central Park Ave Unit 1
- 4646 N Central Park Ave Unit 2
- 4640 N Central Park Ave
- 4640 N Central Park Ave Unit B
- 4640 N Central Park Ave Unit 1
- 4636 N Central Park Ave Unit 3
- 4636 N Central Park Ave Unit 1
- 4636 N Central Park Ave Unit 2
- 4636 N Central Park Ave
- 4654 N Central Park Ave Unit 46
- 4654 N Central Park Ave Unit 46
- 4654 N Central Park Ave Unit 46