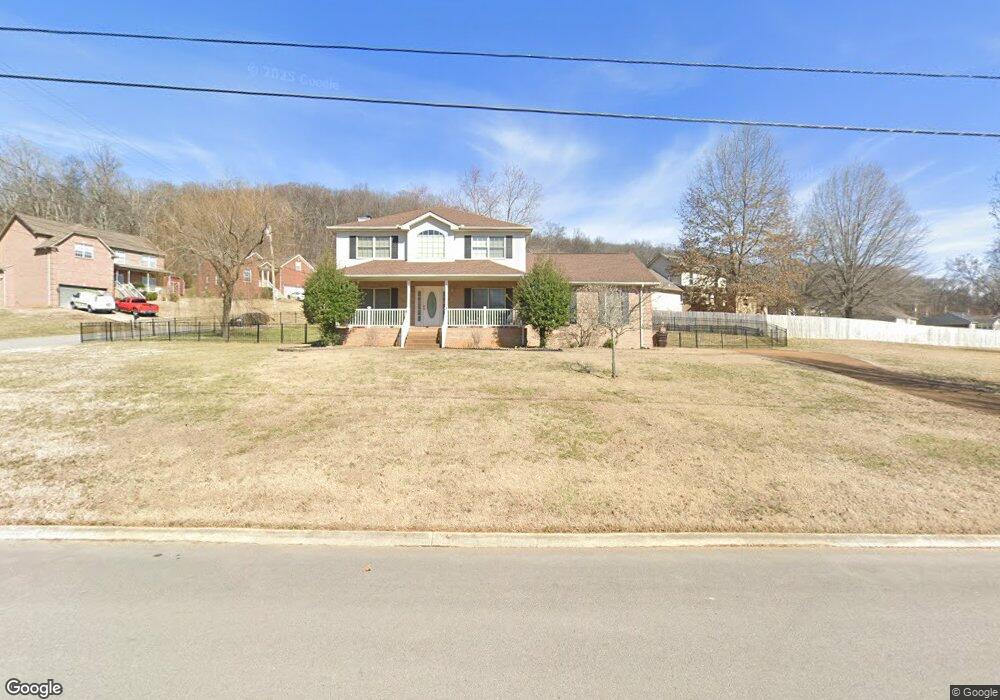
4645 Indian Summer Dr Nashville, TN 37207
Joelton NeighborhoodEstimated Value: $416,837 - $704,000
3
Beds
3
Baths
2,364
Sq Ft
$220/Sq Ft
Est. Value
About This Home
This home is located at 4645 Indian Summer Dr, Nashville, TN 37207 and is currently estimated at $520,709, approximately $220 per square foot. 4645 Indian Summer Dr is a home located in Davidson County with nearby schools including Bellshire Elementary Design Center, Madison Middle Prep, and Hunters Lane Comprehensive High School.
Ownership History
Date
Name
Owned For
Owner Type
Purchase Details
Closed on
Dec 10, 2008
Sold by
Legnon Glenn J and Legnon Sherrill D
Bought by
Henry Stephanie
Current Estimated Value
Home Financials for this Owner
Home Financials are based on the most recent Mortgage that was taken out on this home.
Original Mortgage
$170,400
Outstanding Balance
$112,426
Interest Rate
6.1%
Mortgage Type
Unknown
Estimated Equity
$408,283
Purchase Details
Closed on
Nov 7, 1997
Sold by
Pennington Dwight
Bought by
Legnon Glenn J
Home Financials for this Owner
Home Financials are based on the most recent Mortgage that was taken out on this home.
Original Mortgage
$132,900
Interest Rate
7.31%
Purchase Details
Closed on
Jun 11, 1997
Sold by
Developers The
Bought by
Pennington Dwight
Create a Home Valuation Report for This Property
The Home Valuation Report is an in-depth analysis detailing your home's value as well as a comparison with similar homes in the area
Home Values in the Area
Average Home Value in this Area
Purchase History
| Date | Buyer | Sale Price | Title Company |
|---|---|---|---|
| Henry Stephanie | $213,000 | None Available | |
| Legnon Glenn J | $139,900 | -- | |
| Legnon Glenn J | $139,900 | -- | |
| Pennington Dwight | $19,500 | -- |
Source: Public Records
Mortgage History
| Date | Status | Borrower | Loan Amount |
|---|---|---|---|
| Open | Henry Stephanie | $170,400 | |
| Previous Owner | Legnon Glenn J | $132,900 |
Source: Public Records
Tax History Compared to Growth
Tax History
| Year | Tax Paid | Tax Assessment Tax Assessment Total Assessment is a certain percentage of the fair market value that is determined by local assessors to be the total taxable value of land and additions on the property. | Land | Improvement |
|---|---|---|---|---|
| 2024 | $2,290 | $78,375 | $15,000 | $63,375 |
| 2023 | $2,290 | $78,375 | $15,000 | $63,375 |
| 2022 | $2,290 | $78,375 | $15,000 | $63,375 |
| 2021 | $2,314 | $78,375 | $15,000 | $63,375 |
| 2020 | $2,003 | $52,875 | $10,750 | $42,125 |
| 2019 | $1,457 | $52,875 | $10,750 | $42,125 |
| 2018 | $1,457 | $52,875 | $10,750 | $42,125 |
| 2017 | $1,457 | $52,875 | $10,750 | $42,125 |
| 2016 | $1,791 | $45,650 | $7,500 | $38,150 |
| 2015 | $1,791 | $45,650 | $7,500 | $38,150 |
| 2014 | $1,791 | $45,650 | $7,500 | $38,150 |
Source: Public Records
Map
Nearby Homes
- 4729 Indian Summer Dr
- 4290 Brick Church Pike
- 4251 Brick Church Pike
- 1598 Hunters Ln
- 0 Brick Church Pike Unit RTC2990859
- 0 Creek Trail Dr
- 4748 Lickton Pike
- 2344 Misty Creek Ct
- 4065 Brick Church Pike
- 4044 Brick Church Pike
- 2140 Creekland View Blvd
- 4794 Brick Church Pike
- 2584 Misty Creek Ct
- 2846 Misty Creek Ct
- 1765 Misty Creek Ct
- 2269 Misty Creek Ct
- 1304 Cheshire Dr
- 10 Hillenglade Dr
- 4112 Marydale Dr
- 3975 Lawing Dr
- 4641 Indian Summer Dr
- 2176 Quail Ridge Dr
- 4652 Indian Summer Dr
- 4656 Indian Summer Dr
- 2177 Quail Ridge Dr
- 4637 Indian Summer Dr
- 2173 Quail Ridge Dr
- 2201 Quail Ridge Dr
- 4644 Indian Summer Dr
- 2172 Quail Ridge Dr
- 4640 Indian Summer Dr
- 2204 Quail Ridge Dr
- 2169 Quail Ridge Dr
- 4705 Indian Summer Dr
- 4636 Indian Summer Dr
- 2205 Quail Ridge Dr
- 4621 Indian Summer Dr
- 4620 Indian Summer Dr
- 4704 Indian Summer Dr
- 2168 Quail Ridge Dr