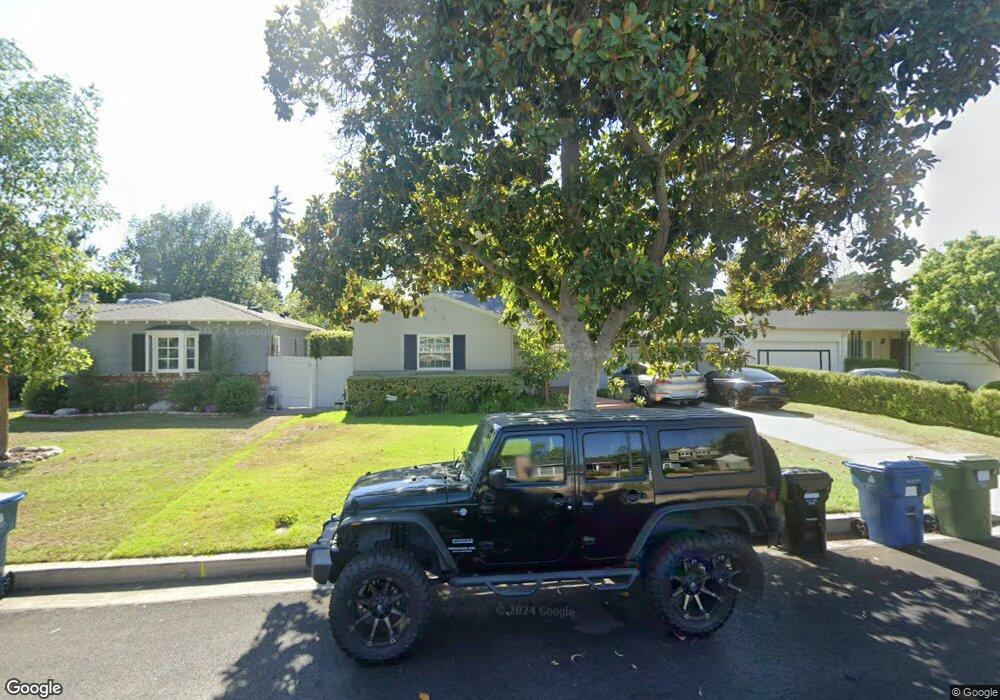
4647 Wortser Ave Sherman Oaks, CA 91423
Estimated Value: $1,681,000 - $2,060,000
4
Beds
3
Baths
2,562
Sq Ft
$724/Sq Ft
Est. Value
About This Home
This home is located at 4647 Wortser Ave, Sherman Oaks, CA 91423 and is currently estimated at $1,854,165, approximately $723 per square foot. 4647 Wortser Ave is a home located in Los Angeles County with nearby schools including Ulysses S. Grant Senior High School, Riverside Drive Charter Elementary School, and Dixie Canyon Avenue Elementary School.
Ownership History
Date
Name
Owned For
Owner Type
Purchase Details
Closed on
Nov 28, 2001
Sold by
Romano James M
Bought by
Romano James M and Romano Stacey D
Current Estimated Value
Purchase Details
Closed on
May 17, 2001
Sold by
Glink Todd A
Bought by
Romano James M and Romano Stacey D
Home Financials for this Owner
Home Financials are based on the most recent Mortgage that was taken out on this home.
Original Mortgage
$408,000
Outstanding Balance
$153,587
Interest Rate
7.14%
Estimated Equity
$1,700,578
Purchase Details
Closed on
Apr 21, 1998
Sold by
Yocca Mark W
Bought by
Glink Todd A and Glink Jill R
Home Financials for this Owner
Home Financials are based on the most recent Mortgage that was taken out on this home.
Original Mortgage
$328,000
Interest Rate
7.25%
Create a Home Valuation Report for This Property
The Home Valuation Report is an in-depth analysis detailing your home's value as well as a comparison with similar homes in the area
Home Values in the Area
Average Home Value in this Area
Purchase History
| Date | Buyer | Sale Price | Title Company |
|---|---|---|---|
| Romano James M | -- | Chicago Title | |
| Romano James M | $510,000 | Southland Title Corporation | |
| Glink Todd A | $410,000 | Equity Title |
Source: Public Records
Mortgage History
| Date | Status | Borrower | Loan Amount |
|---|---|---|---|
| Open | Romano James M | $408,000 | |
| Previous Owner | Glink Todd A | $328,000 | |
| Closed | Glink Todd A | $41,000 | |
| Closed | Romano James M | $50,950 |
Source: Public Records
Tax History Compared to Growth
Tax History
| Year | Tax Paid | Tax Assessment Tax Assessment Total Assessment is a certain percentage of the fair market value that is determined by local assessors to be the total taxable value of land and additions on the property. | Land | Improvement |
|---|---|---|---|---|
| 2025 | $10,625 | $879,336 | $471,484 | $407,852 |
| 2024 | $10,625 | $862,095 | $462,240 | $399,855 |
| 2023 | $10,420 | $845,192 | $453,177 | $392,015 |
| 2022 | $9,936 | $828,621 | $444,292 | $384,329 |
| 2021 | $9,805 | $812,375 | $435,581 | $376,794 |
| 2019 | $9,511 | $788,281 | $422,662 | $365,619 |
| 2018 | $9,408 | $772,825 | $414,375 | $358,450 |
| 2016 | $8,976 | $742,817 | $398,285 | $344,532 |
| 2015 | $8,844 | $731,660 | $392,303 | $339,357 |
| 2014 | $8,850 | $626,892 | $384,619 | $242,273 |
Source: Public Records
Map
Nearby Homes
- 4659 Morse Ave
- 4719 Wortser Ave
- 4620 Morse Ave
- 13042 Riverside Dr
- 4660 Ave Unit 10
- 4644 Coldwater Canyon Ave Unit 403
- 4660 Coldwater Canyon Ave Unit 4
- 4539 Atoll Ave
- 4816 Atoll Ave
- 12947 La Maida St
- 12843 Sarah St
- 4822 Van Noord Ave Unit 14
- 4822 Van Noord Ave Unit 6
- 4702 Fulton Ave Unit 107
- 4702 Fulton Ave Unit 202
- 4702 Fulton Ave Unit 304
- 4445 Van Noord Ave
- 4615 Fulton Ave
- 13021 Moorpark St
- 4609 Goodland Ave
- 4639 Wortser Ave
- 4651 Wortser Ave
- 4635 Wortser Ave
- 4659 Wortser Ave
- 4640 Ethel Ave
- 4648 Ethel Ave
- 4634 Ethel Ave
- 4658 Ethel Ave
- 4627 Wortser Ave
- 4644 Wortser Ave
- 4652 Wortser Ave
- 4638 Wortser Ave
- 4626 Ethel Ave
- 4634 Wortser Ave
- 4658 Wortser Ave
- 4621 Wortser Ave
- 4703 Wortser Ave
- 4620 Ethel Ave
- 4630 Wortser Ave
- 4702 Ethel Ave