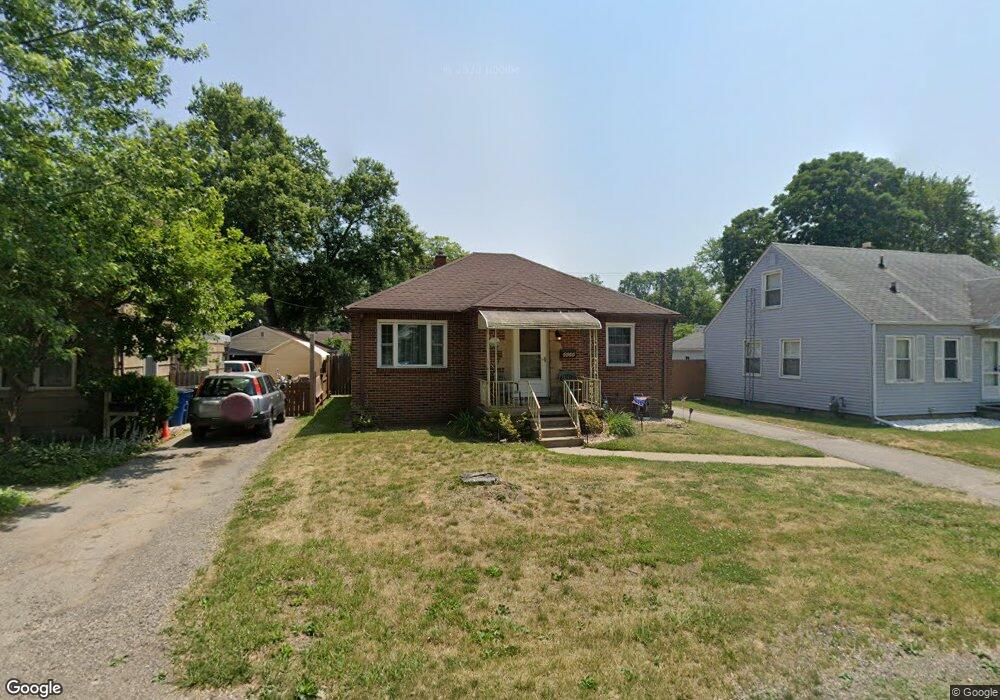
4648 Luann Ave Toledo, OH 43623
Franklin Park NeighborhoodEstimated Value: $152,000 - $186,000
2
Beds
1
Bath
1,033
Sq Ft
$167/Sq Ft
Est. Value
About This Home
This home is located at 4648 Luann Ave, Toledo, OH 43623 and is currently estimated at $172,351, approximately $166 per square foot. 4648 Luann Ave is a home located in Lucas County with nearby schools including Monac Elementary School, Jefferson Junior High School, and Washington Junior High School.
Ownership History
Date
Name
Owned For
Owner Type
Purchase Details
Closed on
May 18, 2001
Sold by
Glover Douglas G and Glover Laura K
Bought by
Whetsel Timothy E and Whetsel Sandra L
Current Estimated Value
Home Financials for this Owner
Home Financials are based on the most recent Mortgage that was taken out on this home.
Original Mortgage
$109,137
Outstanding Balance
$40,721
Interest Rate
7.02%
Mortgage Type
FHA
Estimated Equity
$131,630
Purchase Details
Closed on
Jun 3, 1996
Sold by
Williams Sharon J
Bought by
Glover Douglas G and Nowak Laura K
Home Financials for this Owner
Home Financials are based on the most recent Mortgage that was taken out on this home.
Original Mortgage
$59,000
Interest Rate
7.99%
Mortgage Type
Balloon
Purchase Details
Closed on
Apr 12, 1995
Sold by
Society Bank & Trust Trs
Bought by
Williams Sharon J
Home Financials for this Owner
Home Financials are based on the most recent Mortgage that was taken out on this home.
Original Mortgage
$61,750
Interest Rate
8.55%
Mortgage Type
New Conventional
Purchase Details
Closed on
May 14, 1992
Sold by
Deye Frances L
Create a Home Valuation Report for This Property
The Home Valuation Report is an in-depth analysis detailing your home's value as well as a comparison with similar homes in the area
Home Values in the Area
Average Home Value in this Area
Purchase History
| Date | Buyer | Sale Price | Title Company |
|---|---|---|---|
| Whetsel Timothy E | $110,000 | -- | |
| Glover Douglas G | $69,000 | -- | |
| Williams Sharon J | $65,000 | -- | |
| -- | $59,000 | -- |
Source: Public Records
Mortgage History
| Date | Status | Borrower | Loan Amount |
|---|---|---|---|
| Open | Whetsel Timothy E | $109,137 | |
| Closed | Glover Douglas G | $59,000 | |
| Previous Owner | Williams Sharon J | $61,750 |
Source: Public Records
Tax History Compared to Growth
Tax History
| Year | Tax Paid | Tax Assessment Tax Assessment Total Assessment is a certain percentage of the fair market value that is determined by local assessors to be the total taxable value of land and additions on the property. | Land | Improvement |
|---|---|---|---|---|
| 2024 | $1,201 | $48,685 | $7,000 | $41,685 |
| 2023 | $2,633 | $45,920 | $6,335 | $39,585 |
| 2022 | $2,643 | $45,920 | $6,335 | $39,585 |
| 2021 | $2,715 | $45,920 | $6,335 | $39,585 |
| 2020 | $2,472 | $37,695 | $5,215 | $32,480 |
| 2019 | $2,394 | $37,695 | $5,215 | $32,480 |
| 2018 | $1,933 | $37,695 | $5,215 | $32,480 |
| 2017 | $1,529 | $27,300 | $4,795 | $22,505 |
| 2016 | $1,538 | $78,000 | $13,700 | $64,300 |
| 2015 | $1,557 | $78,000 | $13,700 | $64,300 |
| 2014 | $1,265 | $27,310 | $4,800 | $22,510 |
| 2013 | $1,265 | $27,310 | $4,800 | $22,510 |
Source: Public Records
Map
Nearby Homes
- 4639 Boydson Dr
- 4641 Naomi Dr
- 4838 Clover Ln
- 4744 Kathy Ln
- 3605 W Laskey Rd
- 3751 Philmar Dr
- 3510 W Laskey Rd
- 3755 Baybrook Ln
- 5104 Tillimon Trail
- 3553 Cedardale Ct
- 3513 Cedardale Ct
- 4122 Briarcrest Rd
- 5231 Calyx Ln
- 3560 Helene Ct
- 5208 Oakridge Dr
- 4150 Caravelle Dr
- 5240 Rambo Ln
- 3834 Donegal Dr
- 5044 Secor Rd
- 5307 Clover Ln
- 4642 Luann Ave
- 4650 Luann Ave
- 4638 Luann Ave
- 4708 Luann Ave
- 4647 Harvest Ln
- 4639 Harvest Ln
- 4651 Harvest Ln
- 4632 Luann Ave
- 4635 Harvest Ln
- 4703 Harvest Ln
- 4649 Luann Ave
- 4651 Luann Ave
- 4641 Luann Ave
- 4631 Harvest Ln
- 4628 Luann Ave
- 4714 Luann Ave
- 4707 Harvest Ln
- 4705 Luann Ave
- 4637 Luann Ave
- 4709 Luann Ave