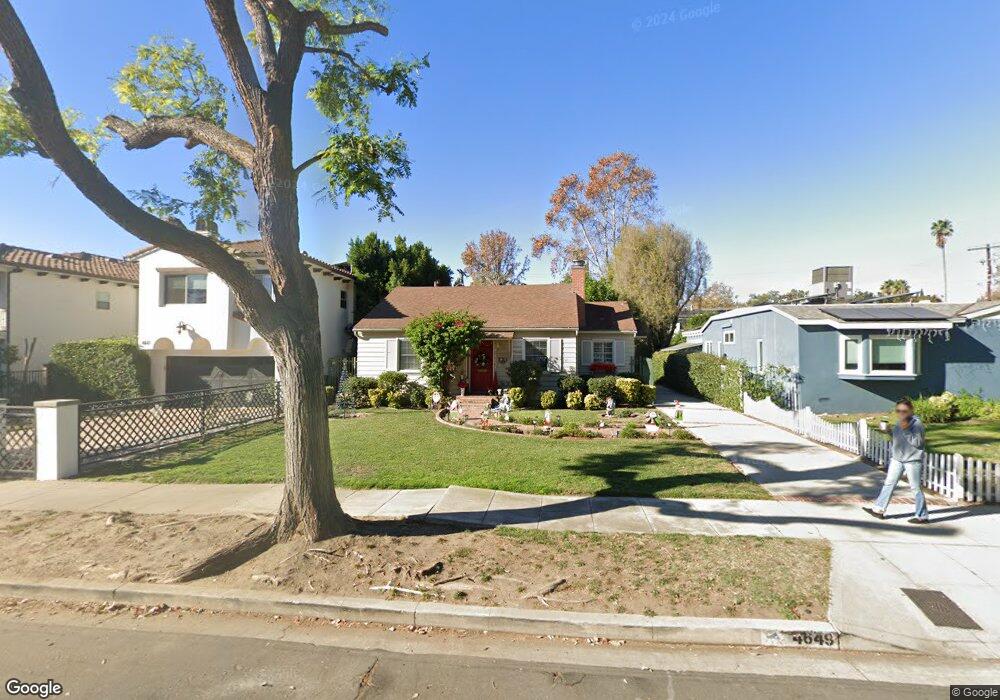
4649 Atoll Ave Sherman Oaks, CA 91423
Estimated Value: $1,435,030 - $1,555,000
2
Beds
2
Baths
1,326
Sq Ft
$1,112/Sq Ft
Est. Value
About This Home
This home is located at 4649 Atoll Ave, Sherman Oaks, CA 91423 and is currently estimated at $1,475,008, approximately $1,112 per square foot. 4649 Atoll Ave is a home located in Los Angeles County with nearby schools including Ulysses S. Grant Senior High School, Riverside Drive Charter Elementary School, and Dixie Canyon Avenue Elementary School.
Ownership History
Date
Name
Owned For
Owner Type
Purchase Details
Closed on
Nov 8, 2016
Sold by
Lowry Lenore P
Bought by
Lowry Lenore P and Howlett Bette Jo
Current Estimated Value
Purchase Details
Closed on
Sep 2, 2003
Sold by
Doryon Dan and Doryon Vicky
Bought by
Lowry Lenore P
Home Financials for this Owner
Home Financials are based on the most recent Mortgage that was taken out on this home.
Original Mortgage
$280,000
Outstanding Balance
$130,428
Interest Rate
6.3%
Mortgage Type
Purchase Money Mortgage
Estimated Equity
$1,344,580
Purchase Details
Closed on
Mar 12, 2002
Sold by
Tonkins Joshua and Tonkins Heather
Bought by
Arkin Linda
Purchase Details
Closed on
Nov 13, 1998
Sold by
Mckenzie Kevin and Estate Of Louise L Bayman
Bought by
Tonkins Joshua
Home Financials for this Owner
Home Financials are based on the most recent Mortgage that was taken out on this home.
Original Mortgage
$222,800
Interest Rate
6.86%
Create a Home Valuation Report for This Property
The Home Valuation Report is an in-depth analysis detailing your home's value as well as a comparison with similar homes in the area
Home Values in the Area
Average Home Value in this Area
Purchase History
| Date | Buyer | Sale Price | Title Company |
|---|---|---|---|
| Lowry Lenore P | -- | None Available | |
| Lowry Lenore P | $560,000 | First American Title Co | |
| Arkin Linda | $450,000 | Equity Title Company | |
| Tonkins Joshua | $278,500 | First American Title Co |
Source: Public Records
Mortgage History
| Date | Status | Borrower | Loan Amount |
|---|---|---|---|
| Open | Lowry Lenore P | $280,000 | |
| Previous Owner | Tonkins Joshua | $222,800 |
Source: Public Records
Tax History Compared to Growth
Tax History
| Year | Tax Paid | Tax Assessment Tax Assessment Total Assessment is a certain percentage of the fair market value that is determined by local assessors to be the total taxable value of land and additions on the property. | Land | Improvement |
|---|---|---|---|---|
| 2025 | $9,600 | $796,183 | $636,954 | $159,229 |
| 2024 | $9,600 | $780,572 | $624,465 | $156,107 |
| 2023 | $9,414 | $765,268 | $612,221 | $153,047 |
| 2022 | $8,975 | $750,264 | $600,217 | $150,047 |
| 2021 | $8,864 | $735,554 | $588,449 | $147,105 |
| 2019 | $8,598 | $713,740 | $570,997 | $142,743 |
| 2018 | $8,536 | $699,746 | $559,801 | $139,945 |
| 2016 | $8,159 | $672,575 | $538,064 | $134,511 |
| 2015 | $8,040 | $662,473 | $529,982 | $132,491 |
| 2014 | $8,070 | $649,497 | $519,601 | $129,896 |
Source: Public Records
Map
Nearby Homes
- 4539 Atoll Ave
- 4615 Fulton Ave
- 4702 Fulton Ave Unit 107
- 4702 Fulton Ave Unit 202
- 4702 Fulton Ave Unit 304
- 4634 Nagle Ave
- 4455 Fulton Ave Unit 3
- 4719 Wortser Ave
- 4816 Atoll Ave
- 13042 Riverside Dr
- 4659 Morse Ave
- 4620 Morse Ave
- 13331 Moorpark St Unit 123
- 13331 Moorpark St Unit 206
- 13331 Moorpark St Unit 319
- 13200 Moorpark St Unit 201
- 13021 Moorpark St
- 4546 Allott Ave
- 4445 Van Noord Ave
- 4545 Allott Ave
- 4643 Atoll Ave
- 4659 Atoll Ave
- 4639 Atoll Ave
- 4648 Longridge Ave
- 4635 Atoll Ave
- 4644 Longridge Ave
- 4658 Longridge Ave
- 4631 Atoll Ave
- 4636 Longridge Ave
- 4648 Atoll Ave
- 4640 Atoll Ave
- 4658 Atoll Ave
- 4705 Atoll Ave
- 4627 Atoll Ave
- 4630 Longridge Ave
- 4702 Longridge Ave
- 4702 Atoll Ave
- 4711 Atoll Ave
- 4617 Atoll Ave
- 4622 Longridge Ave