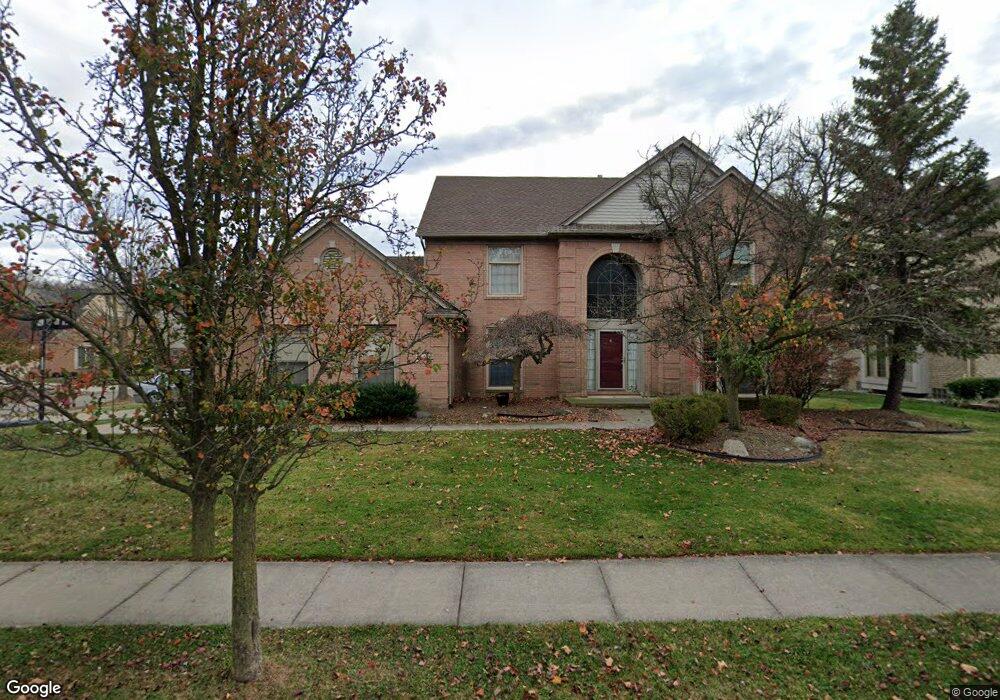
46491 Glengarry Blvd Unit Bldg-Unit Canton, MI 48188
Estimated Value: $593,000 - $649,000
Studio
3
Baths
2,896
Sq Ft
$214/Sq Ft
Est. Value
About This Home
This home is located at 46491 Glengarry Blvd Unit Bldg-Unit, Canton, MI 48188 and is currently estimated at $619,179, approximately $213 per square foot. 46491 Glengarry Blvd Unit Bldg-Unit is a home located in Wayne County with nearby schools including Canton High School, Plymouth High School, and Salem High School.
Ownership History
Date
Name
Owned For
Owner Type
Purchase Details
Closed on
Nov 21, 2014
Sold by
Chapp Martina O and Chapp David J
Bought by
Opel Holdings Llc
Current Estimated Value
Home Financials for this Owner
Home Financials are based on the most recent Mortgage that was taken out on this home.
Original Mortgage
$297,600
Interest Rate
3.94%
Mortgage Type
New Conventional
Purchase Details
Closed on
Oct 31, 2014
Sold by
Opel Holdings Llc
Bought by
Chapp Martina O
Home Financials for this Owner
Home Financials are based on the most recent Mortgage that was taken out on this home.
Original Mortgage
$297,600
Interest Rate
3.94%
Mortgage Type
New Conventional
Purchase Details
Closed on
Sep 13, 2012
Sold by
Chapp Martina Opel and Opel Martina I
Bought by
Opel Holdings Llc
Purchase Details
Closed on
Nov 2, 2007
Sold by
Polich Jennifer
Bought by
Opel Martina I
Purchase Details
Closed on
May 21, 2003
Sold by
Scott Jeffrey L and Scott Crystal A
Bought by
Polich Jennifer
Create a Home Valuation Report for This Property
The Home Valuation Report is an in-depth analysis detailing your home's value as well as a comparison with similar homes in the area
Home Values in the Area
Average Home Value in this Area
Purchase History
We collect this data history from publicly available records. To have your information removed, we recommend requesting removal directly through your county’s website.
| Date | Buyer | Sale Price | Title Company |
|---|---|---|---|
| Opel Holdings Llc | -- | Bell Title | |
| Chapp Martina O | -- | Bell Title | |
| Opel Holdings Llc | -- | None Available | |
| Opel Martina I | $345,050 | Transnation Title Ins Co | |
| Polich Jennifer | $392,400 | First Michigan Title Inc |
Source: Public Records
Mortgage History
We collect this data history from publicly available records. To have your information removed, we recommend requesting removal directly through your county’s website.
| Date | Status | Borrower | Loan Amount |
|---|---|---|---|
| Previous Owner | Chapp Martina O | $297,600 |
Source: Public Records
Tax History
| Year | Tax Paid | Tax Assessment Tax Assessment Total Assessment is a certain percentage of the fair market value that is determined by local assessors to be the total taxable value of land and additions on the property. | Land | Improvement |
|---|---|---|---|---|
| 2025 | $4,262 | $318,300 | $0 | $0 |
| 2024 | $4,141 | $275,300 | $0 | $0 |
| 2023 | $7,922 | $265,700 | $0 | $0 |
| 2022 | $12,288 | $236,200 | $0 | $0 |
| 2021 | $12,052 | $235,600 | $0 | $0 |
| 2020 | $11,762 | $227,800 | $0 | $0 |
| 2019 | $11,543 | $219,430 | $0 | $0 |
| 2018 | $6,819 | $211,860 | $0 | $0 |
| 2017 | $7,104 | $185,900 | $0 | $0 |
| 2016 | $9,375 | $187,800 | $0 | $0 |
| 2015 | $16,240 | $165,760 | $0 | $0 |
| 2013 | $15,732 | $170,410 | $0 | $0 |
| 2010 | -- | $144,650 | $71,269 | $73,381 |
Source: Public Records
Map
Nearby Homes
- 45523 Muirfield Dr
- 337 Country Club Ct
- 45498 Muirfield Dr
- 47046 Eastbourne Rd
- 51083 Meadowlands
- 50109 Ogden Rd
- 50192 Ogden Rd
- 47272 Woodlong Dr
- 45863 Baywood Blvd
- 45088 Danbury Rd
- 1752 Thistle Dr
- 1774 Thistle Dr
- 271 Edington Cir
- 46501 Killarney Cir
- 8517 N Beck Rd
- 48030 Cherry Hill Rd
- 1805 Lincoln Dr
- 1051 Wellington Ct
- 47450 Ellery Ln
- 45766 Aragon Ln Unit 85
- 46491 Glengarry Blvd
- 46553 Glengarry Blvd
- 46430 Inverness Rd
- 46403 Inverness Rd
- 46425 Inverness Rd
- 652 Brookmill Ct
- 46462 Inverness Rd
- 630 Brookmill Ct
- 46488 Glengarry Blvd
- 46530 Glengarry Blvd
- 46451 Inverness Rd
- 46446 Glengarry Blvd
- 46562 Glengarry Blvd
- 45555 Glengarry Blvd
- 46475 Inverness Rd
- 674 Brookmill Ct
- 46518 Inverness Rd
- 45550 Muirfield Ct
- 46614 Glengarry Blvd
- 46400 Glengarry Blvd
Your Personal Tour Guide
Ask me questions while you tour the home.