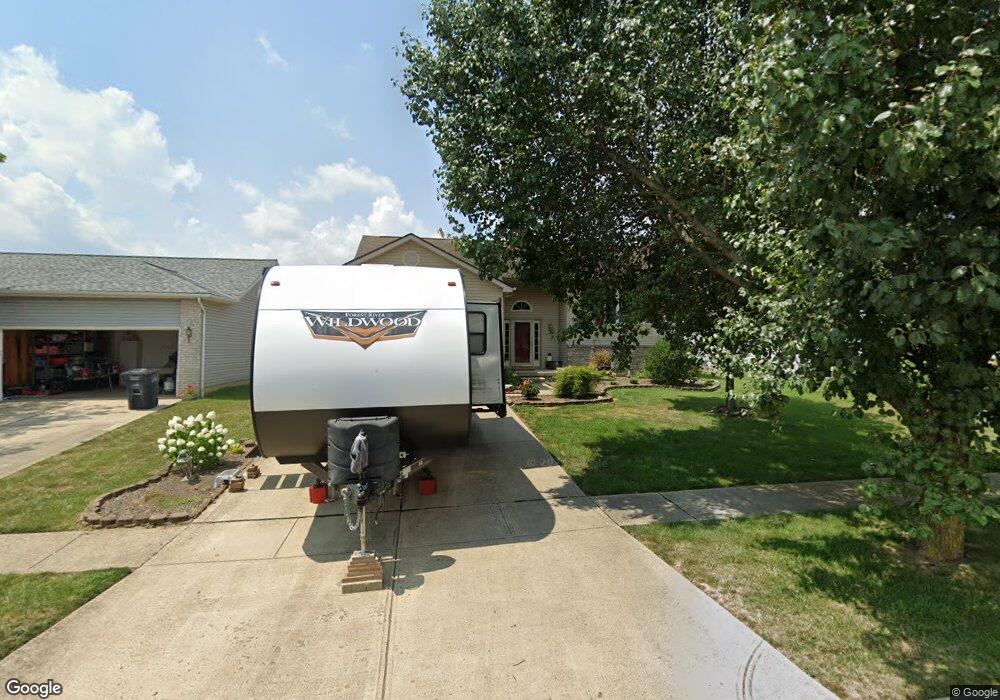
465 Bren Dr Lancaster, OH 43130
Estimated Value: $329,714 - $357,000
4
Beds
3
Baths
1,602
Sq Ft
$216/Sq Ft
Est. Value
About This Home
This home is located at 465 Bren Dr, Lancaster, OH 43130 and is currently estimated at $346,179, approximately $216 per square foot. 465 Bren Dr is a home located in Fairfield County with nearby schools including General Sherman Junior High School, Lancaster High School, and St Mary Elementary School.
Ownership History
Date
Name
Owned For
Owner Type
Purchase Details
Closed on
Oct 1, 2003
Sold by
Wilt Troy A and Wilt Angela T
Bought by
Wilt Troy A and Wilt Angela T
Current Estimated Value
Purchase Details
Closed on
Dec 31, 1998
Sold by
Fairfield Homes Inc
Bought by
Wilt Troy A and Wilt Angela T
Home Financials for this Owner
Home Financials are based on the most recent Mortgage that was taken out on this home.
Original Mortgage
$129,877
Outstanding Balance
$30,617
Interest Rate
6.95%
Mortgage Type
New Conventional
Estimated Equity
$315,562
Create a Home Valuation Report for This Property
The Home Valuation Report is an in-depth analysis detailing your home's value as well as a comparison with similar homes in the area
Home Values in the Area
Average Home Value in this Area
Purchase History
| Date | Buyer | Sale Price | Title Company |
|---|---|---|---|
| Wilt Troy A | -- | -- | |
| Wilt Troy A | $136,693 | -- |
Source: Public Records
Mortgage History
| Date | Status | Borrower | Loan Amount |
|---|---|---|---|
| Open | Wilt Troy A | $129,877 |
Source: Public Records
Tax History Compared to Growth
Tax History
| Year | Tax Paid | Tax Assessment Tax Assessment Total Assessment is a certain percentage of the fair market value that is determined by local assessors to be the total taxable value of land and additions on the property. | Land | Improvement |
|---|---|---|---|---|
| 2024 | $8,132 | $90,450 | $9,820 | $80,630 |
| 2023 | $3,290 | $90,450 | $9,820 | $80,630 |
| 2022 | $3,303 | $90,450 | $9,820 | $80,630 |
| 2021 | $2,746 | $70,440 | $9,350 | $61,090 |
| 2020 | $2,631 | $70,440 | $9,350 | $61,090 |
| 2019 | $2,501 | $70,440 | $9,350 | $61,090 |
| 2018 | $2,118 | $58,830 | $9,350 | $49,480 |
| 2017 | $2,119 | $56,650 | $9,350 | $47,300 |
| 2016 | $2,063 | $56,650 | $9,350 | $47,300 |
| 2015 | $2,119 | $56,470 | $9,350 | $47,120 |
| 2014 | $2,019 | $56,470 | $9,350 | $47,120 |
| 2013 | $2,019 | $56,470 | $9,350 | $47,120 |
Source: Public Records
Map
Nearby Homes
- 1270 Mary Francis Ct
- 935 Elizabeth Dr
- 1741 W Walnut St
- 147 Shawnee Dr
- 114-116 S Cedar Ave
- 221 S Baker Ave
- 1511 Cedar Hill Rd
- 1829 Shoshone Dr
- 1821 Shoshone Dr
- 1318 Cedar Hill Rd
- 1643 W Mulberry St
- 1721 Union St
- 452 Westview Dr
- 130 Boving Rd
- 117 N Pierce Ave
- 539 N Ohio Ave
- 552 Summitview Dr
- 517 Busby Ave
- 0 Highland Ave
- 147 S Roosevelt Ave