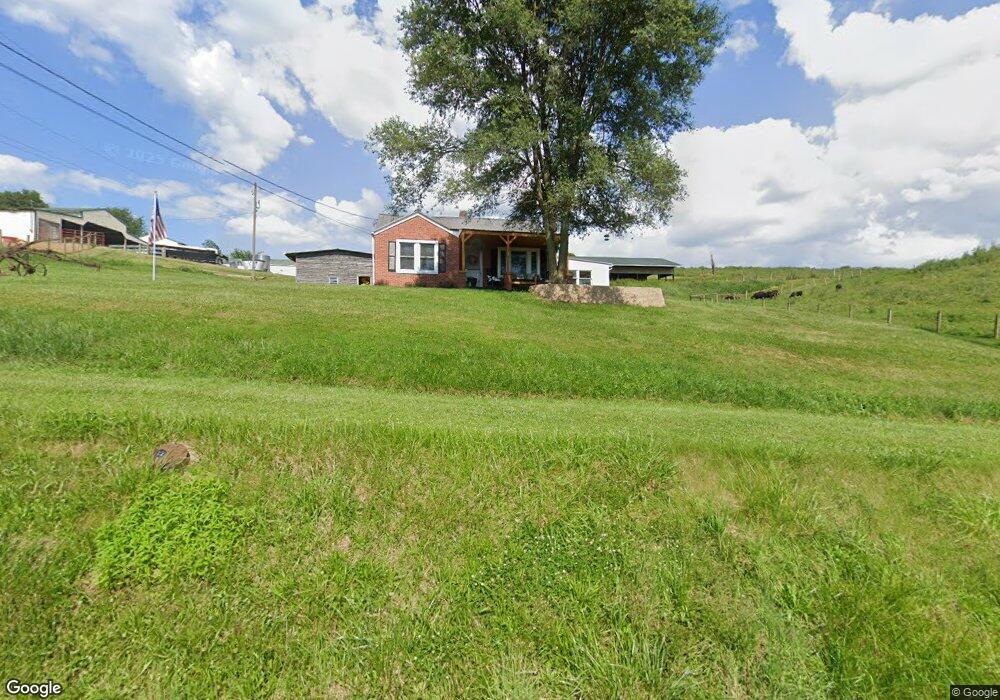
465 Carlock Creek Rd Chilhowie, VA 24319
Estimated Value: $113,000 - $147,000
2
Beds
1
Bath
1,035
Sq Ft
$127/Sq Ft
Est. Value
About This Home
This home is located at 465 Carlock Creek Rd, Chilhowie, VA 24319 and is currently estimated at $131,309, approximately $126 per square foot. 465 Carlock Creek Rd is a home located in Smyth County with nearby schools including Chilhowie Elementary School, Chilhowie Middle School, and Chilhowie High School.
Ownership History
Date
Name
Owned For
Owner Type
Purchase Details
Closed on
Aug 11, 2021
Sold by
Goodwin John A and Goodwin Couliette H
Bought by
Creasy Benjamin Harrison and Creasy Morgan Danielle
Current Estimated Value
Home Financials for this Owner
Home Financials are based on the most recent Mortgage that was taken out on this home.
Original Mortgage
$87,878
Outstanding Balance
$67,275
Interest Rate
2.63%
Mortgage Type
New Conventional
Estimated Equity
$64,034
Purchase Details
Closed on
Sep 30, 2009
Sold by
Hsbc Bank Usa Na
Bought by
Goodwin John A and Goodwin Couliette H
Home Financials for this Owner
Home Financials are based on the most recent Mortgage that was taken out on this home.
Original Mortgage
$56,400
Interest Rate
5.12%
Mortgage Type
Credit Line Revolving
Purchase Details
Closed on
Apr 20, 2009
Sold by
Shelton William L and Shelton Regina
Bought by
Hsbc Bank Usa Na
Create a Home Valuation Report for This Property
The Home Valuation Report is an in-depth analysis detailing your home's value as well as a comparison with similar homes in the area
Home Values in the Area
Average Home Value in this Area
Purchase History
| Date | Buyer | Sale Price | Title Company |
|---|---|---|---|
| Creasy Benjamin Harrison | $87,000 | Attorney | |
| Goodwin John A | $42,500 | -- | |
| Hsbc Bank Usa Na | $56,250 | -- |
Source: Public Records
Mortgage History
| Date | Status | Borrower | Loan Amount |
|---|---|---|---|
| Open | Creasy Benjamin Harrison | $87,878 | |
| Previous Owner | Goodwin John A | $56,400 |
Source: Public Records
Tax History Compared to Growth
Tax History
| Year | Tax Paid | Tax Assessment Tax Assessment Total Assessment is a certain percentage of the fair market value that is determined by local assessors to be the total taxable value of land and additions on the property. | Land | Improvement |
|---|---|---|---|---|
| 2025 | $551 | $93,400 | $12,000 | $81,400 |
| 2024 | $551 | $93,400 | $12,000 | $81,400 |
| 2023 | $460 | $62,200 | $10,000 | $52,200 |
| 2022 | $460 | $62,200 | $10,000 | $52,200 |
| 2021 | $460 | $62,200 | $10,000 | $52,200 |
| 2020 | $460 | $62,200 | $10,000 | $52,200 |
| 2019 | $413 | $55,800 | $10,000 | $45,800 |
| 2018 | $413 | $55,800 | $10,000 | $45,800 |
| 2017 | $413 | $55,800 | $10,000 | $45,800 |
| 2016 | $413 | $55,800 | $10,000 | $45,800 |
| 2015 | $413 | $0 | $0 | $0 |
| 2014 | $419 | $0 | $0 | $0 |
Source: Public Records
Map
Nearby Homes
- TBD Carlock Creek Rd
- 1222 Austin Ln
- TBD Middle Fork Rd
- 1305 E Lee Hwy
- 524 Old Stage Rd
- 109 Depot
- 752 Cleghorn Valley Rd
- 817 Midnight Dr
- 797 Cleghorn Valley Rd
- 1005 Midnight Dr
- 38087 Lee Hwy
- 23 Christin Ln
- 21 Christin Ln
- 25 Christin Ln
- 1269 Conifer Ln
- TBD Lot#19 Christin Ln
- TBD Lot#15 Chestnutwood Dr
- TBD Lot#42 Brooke St
- TBD Lot#8 Elem Dr
- TBD Lo #24 Christin Ln
- 474 Carlock Creek Rd
- 478 Carlock Creek Rd
- 502 Carlock Creek Rd
- 444 Carlock Creek Rd
- 518 Carlock Creek Rd
- 521 Carlock Creek Rd
- 499 Carlock Creek Rd
- 525 Carlock Creek Rd
- 390 Carlock Creek Rd
- 554 Carlock Creek Rd
- 375 Carlock Creek Rd
- 553 Carlock Creek Rd
- 558 Carlock Creek Rd
- TBD Carlock Creek
- 878 Apple Valley Rd
- 872 Apple Valley Rd
- 862 Apple Valley Rd
- 639 Carlock Creek Rd
- 604 Carlock Creek Rd
- 621 Carlock Creek Rd