
Seller's Agent in 2022
Vanessa Foster
Coldwell Banker Realty - Milton
(617) 721-9500
1 in this area
77 Total Sales


Estimated Value: $1,355,000 - $1,402,000
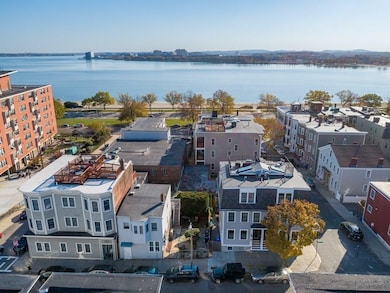
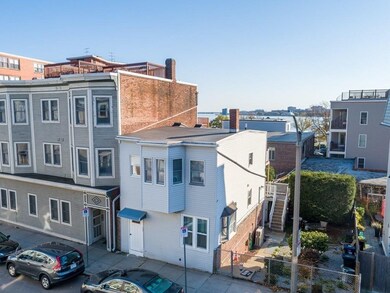
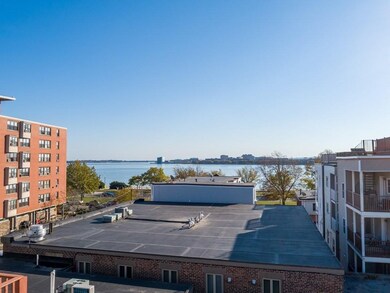
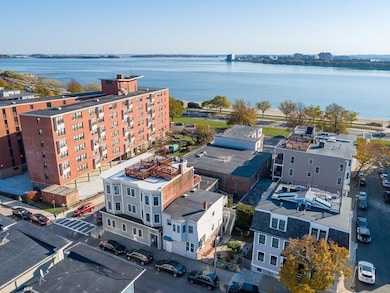
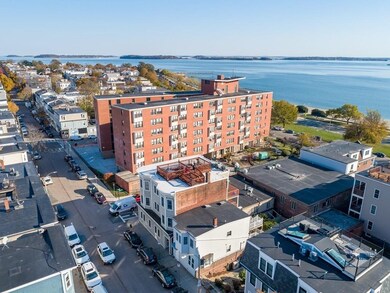
BACK ON THE MARKET WITH A SIGNIFICANT PRICE IMPROVEMENT! This premier East Side Offering! Opportunity knocks at this "Southie Double" lot close to Carson Beach! This three-unit multi-family is ripe for investors to take advantage of a prime location. Property offers an opportunity to renovate, rebuild or expand. Space to build parking and potential rooftop views of the beach make this a lucrative investment. One block from the beach, and no flood insurance needed. Current rent prices are below market value. Private showings only.
Last Agent to Sell the Property
Coldwell Banker Realty - Milton Listed on: 11/16/2021
Last Buyer's Agent
Joseph Rinaldi
FuturePort Realty LLC
| Date | Buyer | Sale Price | Title Company |
|---|---|---|---|
| Rinaldi Pease Titanium | $1,300,000 | None Available | |
| Brennan B Deidre | $195,000 | -- | |
| Brennan B Deidre | $195,000 | -- |
| Date | Status | Borrower | Loan Amount |
|---|---|---|---|
| Open | Rinaldi Pease Titanium | $1,628,000 | |
| Previous Owner | Brennan B Deidre | $300,000 | |
| Previous Owner | Brennan B Deidre | $155,000 |
| Date | Event | Price | List to Sale | Price per Sq Ft |
|---|---|---|---|---|
| 05/24/2022 05/24/22 | Sold | $1,300,000 | 0.0% | $840 / Sq Ft |
| 03/22/2022 03/22/22 | Pending | -- | -- | -- |
| 03/01/2022 03/01/22 | For Sale | -- | -- | -- |
| 02/07/2022 02/07/22 | Off Market | $1,300,000 | -- | -- |
| 11/16/2021 11/16/21 | For Sale | $1,699,000 | -- | $1,098 / Sq Ft |
| Year | Tax Paid | Tax Assessment Tax Assessment Total Assessment is a certain percentage of the fair market value that is determined by local assessors to be the total taxable value of land and additions on the property. | Land | Improvement |
|---|---|---|---|---|
| 2025 | $15,147 | $1,308,000 | $539,900 | $768,100 |
| 2024 | $13,311 | $1,221,200 | $434,100 | $787,100 |
| 2023 | $12,374 | $1,152,100 | $409,500 | $742,600 |
| 2022 | $11,396 | $1,047,400 | $372,300 | $675,100 |
| 2021 | $11,176 | $1,047,400 | $372,300 | $675,100 |
| 2020 | $10,678 | $1,011,200 | $350,600 | $660,600 |
| 2019 | $10,153 | $963,300 | $265,700 | $697,600 |
| 2018 | $9,523 | $908,700 | $265,700 | $643,000 |
| 2017 | $9,161 | $865,100 | $265,700 | $599,400 |
| 2016 | $8,274 | $752,200 | $265,700 | $486,500 |
| 2015 | $7,931 | $654,900 | $217,800 | $437,100 |
| 2014 | $7,006 | $556,900 | $217,800 | $339,100 |
Seller's Agent in 2022
Vanessa Foster
Coldwell Banker Realty - Milton
(617) 721-9500
1 in this area
77 Total Sales
J
Buyer's Agent in 2022
Joseph Rinaldi
FuturePort Realty LLC
Source: MLS Property Information Network (MLS PIN)
MLS Number: 72920495
APN: SBOS-000000-000007-001511
Disclaimer: Certain information contained herein is derived from information provided by parties other than Homes.com. All information provided is deemed reliable, but is not guaranteed to be accurate and should be independently verified.
![]() The property listing data and information, or the Images, set forth herein were provided to MLS Property Information Network, Inc. from third party sources, including sellers, lessors and public records, and were compiled by MLS Property Information Network, Inc. The property listing data and information, and the Images, are for the personal, non-commercial use of consumers having a good faith interest in purchasing or leasing listed properties of the type displayed to them and may not be used for any purpose other than to identify prospective properties which such consumers may have a good faith interest in purchasing or leasing. MLS Property Information Network, Inc. and its subscribers disclaim any and all representations and warranties as to the accuracy of the property listing data and information, or as to the accuracy of any of the Images, set forth herein.
The property listing data and information, or the Images, set forth herein were provided to MLS Property Information Network, Inc. from third party sources, including sellers, lessors and public records, and were compiled by MLS Property Information Network, Inc. The property listing data and information, and the Images, are for the personal, non-commercial use of consumers having a good faith interest in purchasing or leasing listed properties of the type displayed to them and may not be used for any purpose other than to identify prospective properties which such consumers may have a good faith interest in purchasing or leasing. MLS Property Information Network, Inc. and its subscribers disclaim any and all representations and warranties as to the accuracy of the property listing data and information, or as to the accuracy of any of the Images, set forth herein.
Ask me questions while you tour the home.