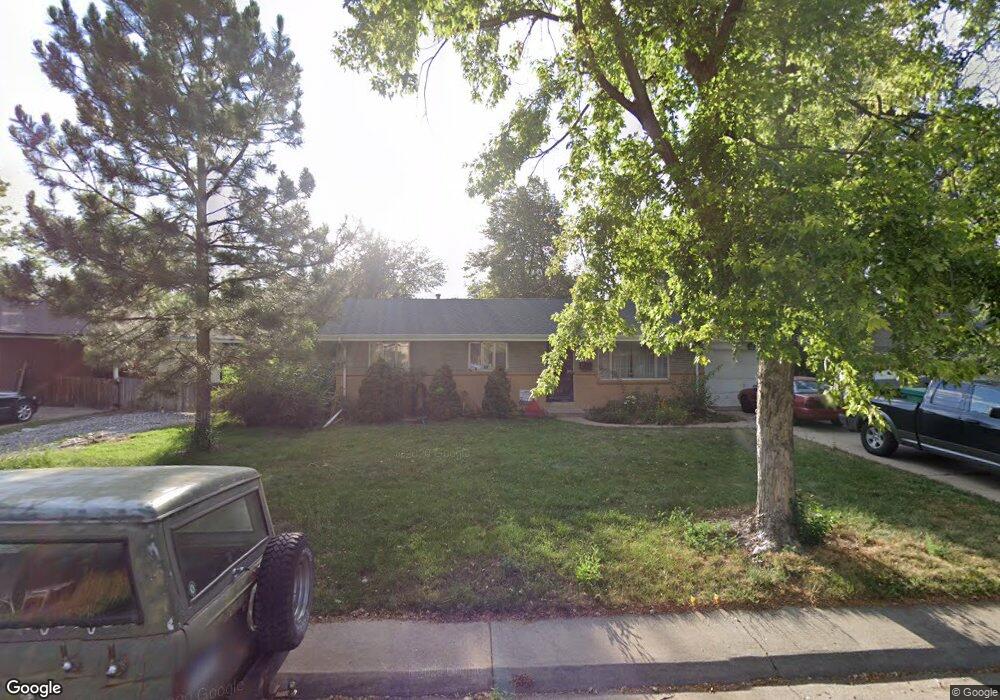
465 Moline St Aurora, CO 80010
Highland Park NeighborhoodEstimated Value: $412,000 - $503,000
4
Beds
2
Baths
1,856
Sq Ft
$237/Sq Ft
Est. Value
About This Home
This home is located at 465 Moline St, Aurora, CO 80010 and is currently estimated at $440,104, approximately $237 per square foot. 465 Moline St is a home located in Arapahoe County with nearby schools including Lansing Elementary Community School, Aurora Hills Middle School, and Aurora Central High School.
Ownership History
Date
Name
Owned For
Owner Type
Purchase Details
Closed on
Oct 21, 2022
Sold by
United Colorado Llc
Bought by
Hajjam Arash
Current Estimated Value
Purchase Details
Closed on
May 18, 2005
Sold by
Bottoms Jack L and Bottoms Ruth E
Bought by
Bottoms Jacky L and Bottoms Ruth E
Home Financials for this Owner
Home Financials are based on the most recent Mortgage that was taken out on this home.
Original Mortgage
$306,000
Interest Rate
4.85%
Mortgage Type
FHA
Purchase Details
Closed on
Jul 4, 1776
Bought by
Conversion Arapco
Create a Home Valuation Report for This Property
The Home Valuation Report is an in-depth analysis detailing your home's value as well as a comparison with similar homes in the area
Home Values in the Area
Average Home Value in this Area
Purchase History
| Date | Buyer | Sale Price | Title Company |
|---|---|---|---|
| Hajjam Arash | $310,000 | First Alliance Title | |
| United Colorado Llc | $300,000 | First Alliance Title | |
| Bottoms Jacky L | -- | Fahtco | |
| Conversion Arapco | -- | -- |
Source: Public Records
Mortgage History
| Date | Status | Borrower | Loan Amount |
|---|---|---|---|
| Previous Owner | Bottoms Jacky L | $306,000 |
Source: Public Records
Tax History
| Year | Tax Paid | Tax Assessment Tax Assessment Total Assessment is a certain percentage of the fair market value that is determined by local assessors to be the total taxable value of land and additions on the property. | Land | Improvement |
|---|---|---|---|---|
| 2025 | $2,716 | $28,031 | -- | -- |
| 2024 | $2,634 | $28,341 | -- | -- |
| 2023 | $2,634 | $28,341 | $0 | $0 |
| 2022 | $1,499 | $21,878 | $0 | $0 |
| 2021 | $1,547 | $21,878 | $0 | $0 |
| 2020 | $1,498 | $21,536 | $0 | $0 |
| 2019 | $1,490 | $21,536 | $0 | $0 |
| 2018 | $1,118 | $17,770 | $0 | $0 |
| 2017 | $972 | $17,770 | $0 | $0 |
| 2016 | $718 | $15,275 | $0 | $0 |
| 2015 | $693 | $15,275 | $0 | $0 |
| 2014 | $446 | $9,472 | $0 | $0 |
| 2013 | -- | $10,880 | $0 | $0 |
Source: Public Records
Map
Nearby Homes
- 531 Nome St
- 234 Nome St
- 740 Moline St
- 740 Newark St
- 745 Lima St
- 11036 & 11038 E 4th Way
- 11612 Del Mar Pkwy
- 765 Moline St
- 11337 E 1st Ave
- 800 Nile St
- 812 Lansing St
- 820 Lansing St
- 10633 E 6th Place
- 840 Kingston St
- 80 Lansing St Unit 80
- 855 Newark St
- 860 Lansing St
- 775 Joliet St
- 11718 E Canal Dr
- 92 Newark St Unit A
Your Personal Tour Guide
Ask me questions while you tour the home.