465 N 100 W Beaver, UT 84713
Estimated Value: $210,000 - $351,000
About This Home
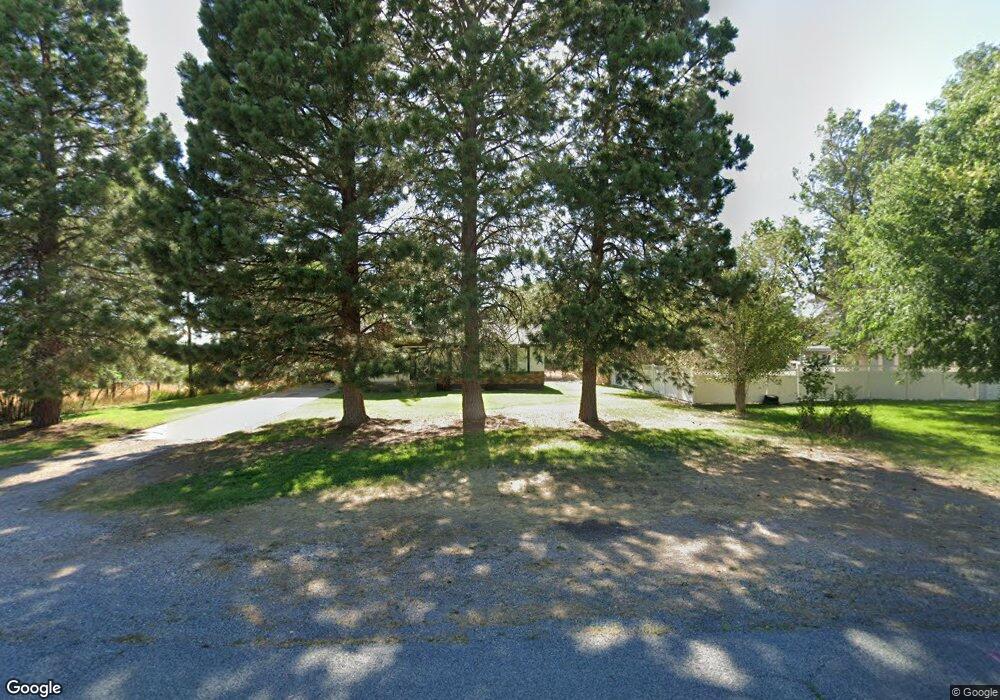
This home is located at 465 N 100 W, Beaver, UT 84713 and is currently estimated at $288,689, approximately $264 per square foot. 465 N 100 W is a home with nearby schools including Belknap School and Beaver High School.
Ownership History
We collect this data history from publicly available records. To have your information removed, we recommend requesting removal directly through your county’s website.
Purchase Details
Purchase Details
Home Financials for this Owner
Home Financials are based on the most recent Mortgage that was taken out on this home.Purchase Details
Home Values in the Area
Average Home Value in this Area
Purchase History
We collect this data history from publicly available records. To have your information removed, we recommend requesting removal directly through your county’s website.
| Date | Buyer | Sale Price | Title Company |
|---|---|---|---|
| -- | None Available | ||
| -- | -- | ||
| -- | -- |
Mortgage History
We collect this data history from publicly available records. To have your information removed, we recommend requesting removal directly through your county’s website.
| Date | Status | Borrower | Loan Amount |
|---|---|---|---|
| Open | $72,000 |
Tax History
We collect this data history from publicly available records. To have your information removed, we recommend requesting removal directly through your county’s website.
| Year | Tax Paid | Tax Assessment Tax Assessment Total Assessment is a certain percentage of the fair market value that is determined by local assessors to be the total taxable value of land and additions on the property. | Land | Improvement |
|---|---|---|---|---|
| 2025 | $1,045 | $253,146 | $40,000 | $213,146 |
| 2024 | $1,052 | $242,701 | $35,000 | $207,701 |
| 2023 | $1,044 | $232,810 | $35,000 | $197,810 |
| 2022 | $906 | $199,842 | $35,000 | $164,842 |
| 2021 | $815 | $173,442 | $30,000 | $143,442 |
| 2020 | $716 | $149,535 | $30,000 | $119,535 |
| 2019 | $664 | $143,843 | $30,000 | $113,843 |
| 2018 | $644 | $133,494 | $30,000 | $103,494 |
| 2017 | $644 | $133,494 | $30,000 | $103,494 |
| 2016 | $636 | $69,767 | $0 | $0 |
| 2015 | $645 | $69,765 | $0 | $0 |
| 2014 | $650 | $69,765 | $0 | $0 |
| 2013 | $680 | $69,765 | $0 | $0 |
Map
- 495 N Main St
- 481 N 100 West St Unit MP14
- 410 N Main St
- 455 N 100 E
- 290 N 100 East St
- 290 N 100 E
- 160 N 100 W
- 250 W 200 N
- 160 E 300 North St
- 135 E 200 St N
- 135 E 200 North St
- 340 W 100 N
- 490 N 300 East St
- 490 N 300 E
- 340 W 100 North St
- 390 W 100 N
- 60 E Center St
- 50 S 100 West St
- 50 S 100 W
- 0 T29s R7w S21 Unit 25-265494
Ask me questions while you tour the home.