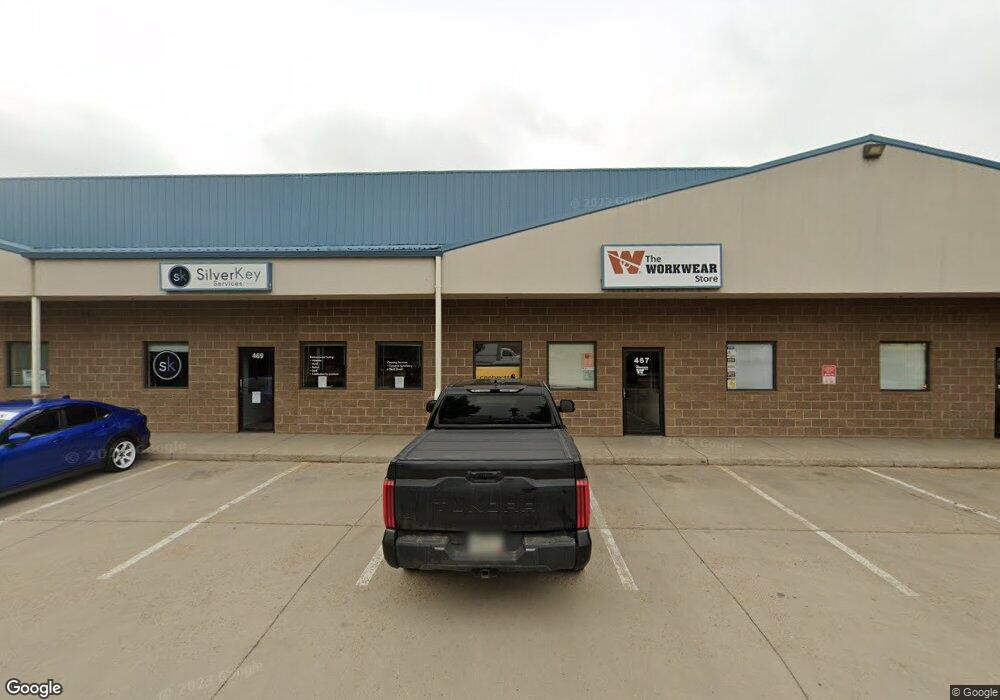
465 N Denver Ave Unit 465 & 467 Loveland, CO 80537
Estimated Value: $426,803 - $443,000
--
Bed
--
Bath
4,051
Sq Ft
$107/Sq Ft
Est. Value
About This Home
This home is located at 465 N Denver Ave Unit 465 & 467, Loveland, CO 80537 and is currently estimated at $434,902, approximately $107 per square foot. 465 N Denver Ave Unit 465 & 467 is a home located in Larimer County with nearby schools including Winona Elementary School, Peakview Academy at Conrad Ball, and Mountain View High School.
Ownership History
Date
Name
Owned For
Owner Type
Purchase Details
Closed on
Oct 6, 2021
Sold by
Integrated Property Investments Inc
Bought by
Integrated Property Investments Inc
Current Estimated Value
Purchase Details
Closed on
Nov 27, 2018
Sold by
Jh Johnstown Llc
Bought by
Intergrated Property Investments Inc
Purchase Details
Closed on
Jul 14, 2017
Sold by
465 North Denver Llc
Bought by
Jh Johnstown Llc
Home Financials for this Owner
Home Financials are based on the most recent Mortgage that was taken out on this home.
Original Mortgage
$191,250
Interest Rate
3.94%
Mortgage Type
Future Advance Clause Open End Mortgage
Purchase Details
Closed on
May 7, 2009
Sold by
Klein Douglas E and Klein Kelly M
Bought by
465 North Denver Llc
Create a Home Valuation Report for This Property
The Home Valuation Report is an in-depth analysis detailing your home's value as well as a comparison with similar homes in the area
Home Values in the Area
Average Home Value in this Area
Purchase History
| Date | Buyer | Sale Price | Title Company |
|---|---|---|---|
| Integrated Property Investments Inc | -- | None Available | |
| Intergrated Property Investments Inc | $291,500 | Land Title Guarantee Co | |
| Jh Johnstown Llc | $255,000 | Land Title Guarantee Company | |
| 465 North Denver Llc | -- | None Available |
Source: Public Records
Mortgage History
| Date | Status | Borrower | Loan Amount |
|---|---|---|---|
| Previous Owner | Jh Johnstown Llc | $191,250 |
Source: Public Records
Tax History Compared to Growth
Tax History
| Year | Tax Paid | Tax Assessment Tax Assessment Total Assessment is a certain percentage of the fair market value that is determined by local assessors to be the total taxable value of land and additions on the property. | Land | Improvement |
|---|---|---|---|---|
| 2025 | $6,012 | $83,700 | $15,150 | $68,550 |
| 2024 | $5,798 | $83,700 | $15,150 | $68,550 |
| 2022 | $5,093 | $64,003 | $15,747 | $48,256 |
| 2021 | $5,087 | $64,003 | $15,747 | $48,256 |
| 2020 | $4,506 | $56,666 | $12,586 | $44,080 |
| 2019 | $4,430 | $56,666 | $12,586 | $44,080 |
| 2018 | $4,344 | $52,780 | $12,586 | $40,194 |
| 2017 | $3,741 | $52,780 | $12,586 | $40,194 |
| 2016 | $3,097 | $42,224 | $12,586 | $29,638 |
| 2015 | $3,071 | $47,650 | $12,590 | $35,060 |
| 2014 | $3,008 | $40,000 | $12,590 | $27,410 |
Source: Public Records
Map
Nearby Homes
- 393 Lavastone Ave
- 1708 Moonstone Cir
- 398 Blue Azurite Ave
- 374 Blue Azurite Ave
- 734 Blue Azurite Ave
- 2306 E 1st St
- 168 Lark Bunting Ave
- 1502 E 5th St
- 947 Delphinus Place
- 1812 E 11th St
- 2505 Pyrite Ct
- 374 Krypton Ct
- 988 Boise Ave
- 162 Farm Museum Ln
- 1343 E 7th St Unit 1
- 235 Carina Cir Unit 105
- 255 Carina Cir Unit 105
- 1413 E 7th St
- 1843 Gemini Ct
- 1335 E 7th St
- 465 N Denver Ave Unit B
- 465 N Denver Ave
- 467 N Denver Ave Unit D467
- 467 N Denver Ave
- 469 N Denver Ave Unit 15
- 469 N Denver Ave Unit 8
- 469 N Denver Ave Unit 101
- 469 N Denver Ave
- 469 N Denver Ave Unit B
- 469 N Denver Ave Unit A
- 471 N Denver Ave Unit D471
- 471 N Denver Ave
- 461 N Denver Ave
- 461 N Denver Ave Unit 461
- 461 N Denver Ave Unit D
- 463 N Denver Ave
- 459 Denver Ave
- 459 Denver Ave
- 473 N Denver Ave
- 457 N Denver Ave