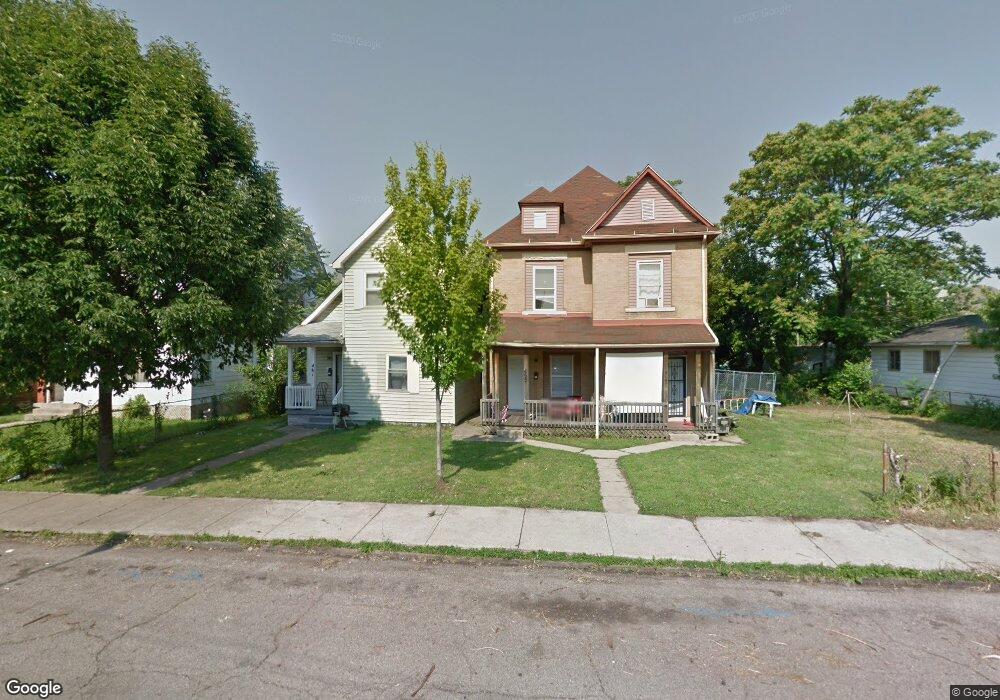
465 N Monroe Ave Unit 467 Columbus, OH 43203
Mount Vernon NeighborhoodEstimated Value: $277,541 - $394,000
6
Beds
2
Baths
2,578
Sq Ft
$131/Sq Ft
Est. Value
About This Home
This home is located at 465 N Monroe Ave Unit 467, Columbus, OH 43203 and is currently estimated at $336,885, approximately $130 per square foot. 465 N Monroe Ave Unit 467 is a home located in Franklin County with nearby schools including Trevitt Elementary School, Champion Middle School, and East High School.
Ownership History
Date
Name
Owned For
Owner Type
Purchase Details
Closed on
Mar 10, 2014
Sold by
24 Ct Real Estate Llc
Bought by
Provens Kelly Theresa and David Provens Legacy Trust
Current Estimated Value
Purchase Details
Closed on
Aug 18, 2008
Sold by
Liquidation Properties Inc
Bought by
24Ct Real Estate Llc
Purchase Details
Closed on
Aug 7, 2008
Sold by
Hayes Charles A and Terwin Advisors Llc
Bought by
Liquidation Property Inc
Purchase Details
Closed on
May 10, 2006
Sold by
Srp Housing Inc
Bought by
Hayes Carl A
Home Financials for this Owner
Home Financials are based on the most recent Mortgage that was taken out on this home.
Original Mortgage
$90,000
Interest Rate
6.54%
Mortgage Type
Purchase Money Mortgage
Purchase Details
Closed on
Jun 10, 1991
Bought by
Srp Housing Ii L P
Purchase Details
Closed on
Aug 22, 1988
Create a Home Valuation Report for This Property
The Home Valuation Report is an in-depth analysis detailing your home's value as well as a comparison with similar homes in the area
Home Values in the Area
Average Home Value in this Area
Purchase History
| Date | Buyer | Sale Price | Title Company |
|---|---|---|---|
| Provens Kelly Theresa | -- | None Available | |
| 24Ct Real Estate Llc | $8,500 | Resource T | |
| Liquidation Property Inc | $103,355 | Resource T | |
| Hayes Carl A | $112,500 | Preferred T | |
| Srp Housing Ii L P | $2,573,900 | -- | |
| -- | $13,500 | -- |
Source: Public Records
Mortgage History
| Date | Status | Borrower | Loan Amount |
|---|---|---|---|
| Previous Owner | Hayes Carl A | $90,000 |
Source: Public Records
Tax History Compared to Growth
Tax History
| Year | Tax Paid | Tax Assessment Tax Assessment Total Assessment is a certain percentage of the fair market value that is determined by local assessors to be the total taxable value of land and additions on the property. | Land | Improvement |
|---|---|---|---|---|
| 2024 | $3,620 | $79,000 | $22,440 | $56,560 |
| 2023 | $3,575 | $78,995 | $22,435 | $56,560 |
| 2022 | $986 | $18,550 | $1,400 | $17,150 |
| 2021 | $988 | $18,550 | $1,400 | $17,150 |
| 2020 | $1,070 | $20,060 | $1,400 | $18,660 |
| 2019 | $1,040 | $16,730 | $1,190 | $15,540 |
| 2018 | $736 | $16,730 | $1,190 | $15,540 |
| 2017 | $758 | $16,730 | $1,190 | $15,540 |
| 2016 | $476 | $7,010 | $2,140 | $4,870 |
| 2015 | $434 | $7,010 | $2,140 | $4,870 |
| 2014 | $435 | $7,010 | $2,140 | $4,870 |
| 2013 | $225 | $7,350 | $2,240 | $5,110 |
Source: Public Records
Map
Nearby Homes
- 865 Old Leonard Ave
- 427 N Garfield Ave
- 423 Saint Clair Ave
- 0 N Monroe Ave
- 456 Saint Clair Ave
- 529 Saint Clair Ave
- 1290 Mount Vernon Ave
- 262 N 17th St
- 247 N 17th St Unit 247
- 241 N 17th St
- 376 N Garfield Ave Unit 78
- 191 Talmadge St
- 262 N 21st St
- 00 Atcheson St
- 1198 Atcheson St
- 0 Atcheson St Unit 224009260
- 166 Miami Ave
- 176 N 20th St
- 542-544 Trevitt St
- 144 Miami Ave
- 465-467 N Monroe Ave
- 461 N Monroe Ave
- 475 N Monroe Ave
- 457 N Monroe Ave
- 453 N Monroe Ave
- 447 N Monroe Ave
- 481 N Monroe Ave Unit 483
- 481 N Monroe Ave
- 474 N Garfield Ave
- 915 Old Leonard Ave
- 468 N Garfield Ave Unit 472
- 482 N Garfield Ave Unit 484
- 464-466-466 N Garfield Ave Unit 466
- 465 N Garfield Ave Unit 467
- 464 N Garfield Ave Unit 466
- 464 N Garfield Ave Unit 66
- 443 N Monroe Ave Unit 445
- 460 N Garfield Ave Unit 462
- 460-462 N Garfield Ave
- 893 Leonard Ave