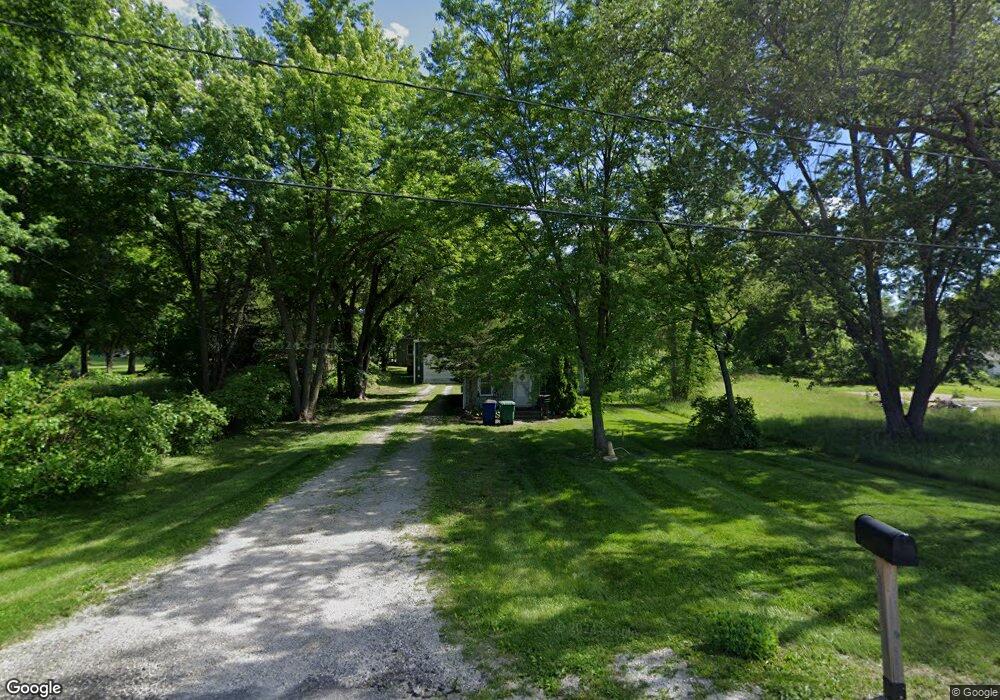
465 NE 43rd Place Des Moines, IA 50313
Marquisville NeighborhoodEstimated Value: $92,000 - $166,000
2
Beds
1
Bath
639
Sq Ft
$202/Sq Ft
Est. Value
About This Home
This home is located at 465 NE 43rd Place, Des Moines, IA 50313 and is currently estimated at $128,873, approximately $201 per square foot. 465 NE 43rd Place is a home located in Polk County with nearby schools including Cornell Elementary School, Woodside Middle School, and Saydel High School.
Ownership History
Date
Name
Owned For
Owner Type
Purchase Details
Closed on
Oct 5, 1999
Sold by
Hodson David W and Hodson Emily K
Bought by
Hatchitt Ryan W
Current Estimated Value
Home Financials for this Owner
Home Financials are based on the most recent Mortgage that was taken out on this home.
Original Mortgage
$36,000
Outstanding Balance
$13,160
Interest Rate
10.87%
Estimated Equity
$115,713
Purchase Details
Closed on
Aug 30, 1999
Sold by
First National Acceptance Company
Bought by
Hodson David and Hodson Emily K
Home Financials for this Owner
Home Financials are based on the most recent Mortgage that was taken out on this home.
Original Mortgage
$36,000
Outstanding Balance
$13,160
Interest Rate
10.87%
Estimated Equity
$115,713
Purchase Details
Closed on
Jun 4, 1997
Sold by
First National Acceptance Co Of America
Bought by
Hodson David W and Hodson Emily K
Home Financials for this Owner
Home Financials are based on the most recent Mortgage that was taken out on this home.
Original Mortgage
$26,250
Interest Rate
8.13%
Create a Home Valuation Report for This Property
The Home Valuation Report is an in-depth analysis detailing your home's value as well as a comparison with similar homes in the area
Home Values in the Area
Average Home Value in this Area
Purchase History
| Date | Buyer | Sale Price | Title Company |
|---|---|---|---|
| Hatchitt Ryan W | $39,500 | -- | |
| Hodson David | -- | -- | |
| Hodson David W | $26,000 | -- |
Source: Public Records
Mortgage History
| Date | Status | Borrower | Loan Amount |
|---|---|---|---|
| Open | Hatchitt Ryan W | $36,000 | |
| Previous Owner | Hodson David W | $26,250 |
Source: Public Records
Tax History Compared to Growth
Tax History
| Year | Tax Paid | Tax Assessment Tax Assessment Total Assessment is a certain percentage of the fair market value that is determined by local assessors to be the total taxable value of land and additions on the property. | Land | Improvement |
|---|---|---|---|---|
| 2025 | $1,402 | $108,500 | $40,500 | $68,000 |
| 2024 | $1,402 | $102,300 | $37,500 | $64,800 |
| 2023 | $1,362 | $102,300 | $37,500 | $64,800 |
| 2022 | $1,340 | $83,600 | $30,200 | $53,400 |
| 2021 | $1,292 | $83,600 | $30,200 | $53,400 |
| 2020 | $1,274 | $76,200 | $26,900 | $49,300 |
| 2019 | $1,238 | $76,200 | $26,900 | $49,300 |
| 2018 | $1,212 | $71,200 | $24,500 | $46,700 |
| 2017 | $1,198 | $71,200 | $24,500 | $46,700 |
| 2016 | $1,170 | $68,600 | $23,000 | $45,600 |
| 2015 | $1,170 | $68,600 | $23,000 | $45,600 |
| 2014 | $1,192 | $69,000 | $22,500 | $46,500 |
Source: Public Records
Map
Nearby Homes
- 475 NE 43rd Place
- 5140 NE 5th St
- 425 NE 43rd Place
- 4360 NE 5th St
- 405 NE 43rd Place
- 385 NE 43rd Place
- 365 NE 43rd Place
- 520 NE 44th Ave
- 460 NE 43rd Ave
- 480 NE 43rd Ave
- 440 NE 43rd Ave
- 510 NE 43rd Ave
- 420 NE 43rd Ave
- 345 NE 43rd Place
- 520 NE 43rd Ave
- 410 NE 43rd Ave
- 540 NE 43rd Ave
- 380 NE 43rd Ave
- 360 NE 43rd Ave