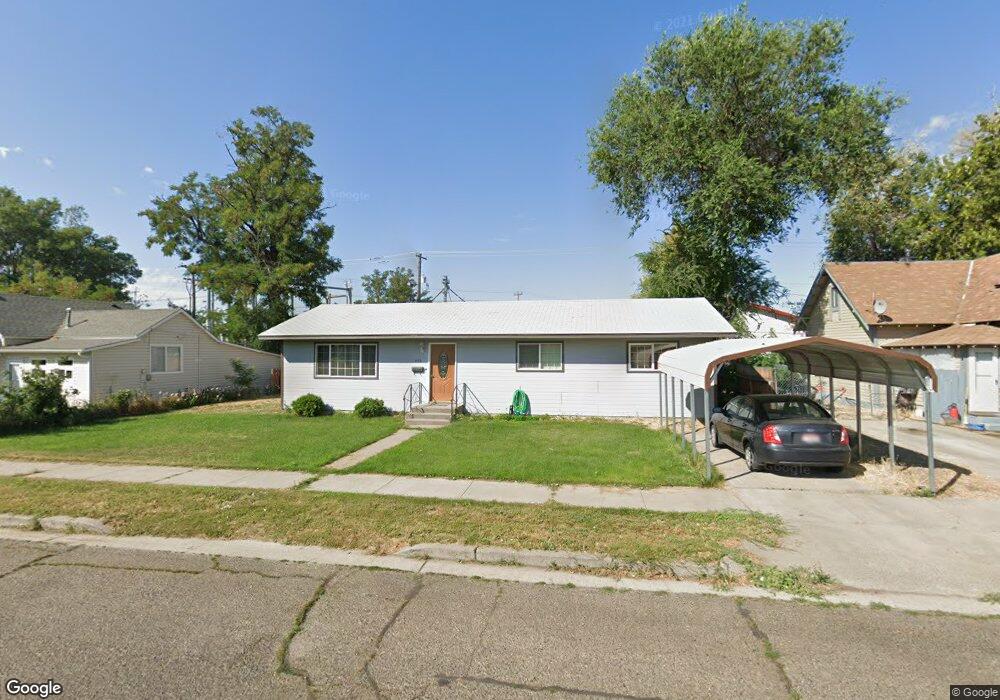
465 S 2nd E Mountain Home, ID 83647
Estimated Value: $252,000 - $273,000
3
Beds
1
Bath
1,200
Sq Ft
$220/Sq Ft
Est. Value
About This Home
This home is located at 465 S 2nd E, Mountain Home, ID 83647 and is currently estimated at $263,680, approximately $219 per square foot. 465 S 2nd E is a home located in Elmore County with nearby schools including East Elementary School, Mountain Home Junior High School, and Hacker Middle School.
Ownership History
Date
Name
Owned For
Owner Type
Purchase Details
Closed on
Jun 8, 2020
Sold by
Doughty Ruffie Retiro
Bought by
Doughty Don S
Current Estimated Value
Home Financials for this Owner
Home Financials are based on the most recent Mortgage that was taken out on this home.
Original Mortgage
$87,000
Outstanding Balance
$76,606
Interest Rate
3.2%
Mortgage Type
New Conventional
Estimated Equity
$187,074
Purchase Details
Closed on
Oct 27, 2011
Sold by
Fannie Mae
Bought by
Retiro Doughty Don S and Retiro Doughty Ruffie
Purchase Details
Closed on
Sep 6, 2011
Sold by
Keeton Maburn
Bought by
Federal National Mortgage Association
Purchase Details
Closed on
Dec 16, 2005
Sold by
Rymer Muriel
Bought by
Keeton Maburn
Home Financials for this Owner
Home Financials are based on the most recent Mortgage that was taken out on this home.
Original Mortgage
$68,000
Interest Rate
7.99%
Mortgage Type
Adjustable Rate Mortgage/ARM
Create a Home Valuation Report for This Property
The Home Valuation Report is an in-depth analysis detailing your home's value as well as a comparison with similar homes in the area
Purchase History
| Date | Buyer | Sale Price | Title Company |
|---|---|---|---|
| Doughty Don S | -- | Pioneer Title & Escrow Corp | |
| Retiro Doughty Don S | -- | Alliance Title & Escrow Corp | |
| Federal National Mortgage Association | -- | None Available | |
| Keeton Maburn | -- | -- |
Source: Public Records
Mortgage History
| Date | Status | Borrower | Loan Amount |
|---|---|---|---|
| Open | Doughty Don S | $87,000 | |
| Previous Owner | Keeton Maburn | $68,000 |
Source: Public Records
Tax History
| Year | Tax Paid | Tax Assessment Tax Assessment Total Assessment is a certain percentage of the fair market value that is determined by local assessors to be the total taxable value of land and additions on the property. | Land | Improvement |
|---|---|---|---|---|
| 2025 | $1,100 | $255,661 | $56,000 | $199,661 |
| 2024 | $1,100 | $254,116 | $49,000 | $205,116 |
| 2023 | $1,131 | $235,090 | $38,000 | $197,090 |
| 2022 | $1,356 | $238,726 | $34,500 | $204,226 |
| 2021 | $1,315 | $176,930 | $28,800 | $148,130 |
| 2020 | $1,184 | $138,215 | $24,000 | $114,215 |
| 2019 | $1,188 | $118,123 | $24,000 | $94,123 |
| 2018 | $1,077 | $95,365 | $20,028 | $75,337 |
| 2017 | $953 | $80,643 | $20,028 | $60,615 |
| 2016 | $904 | $75,434 | $20,028 | $55,406 |
| 2015 | $836 | $0 | $0 | $0 |
| 2012 | -- | $70,167 | $23,562 | $46,605 |
Source: Public Records
Map
Nearby Homes
Your Personal Tour Guide
Ask me questions while you tour the home.