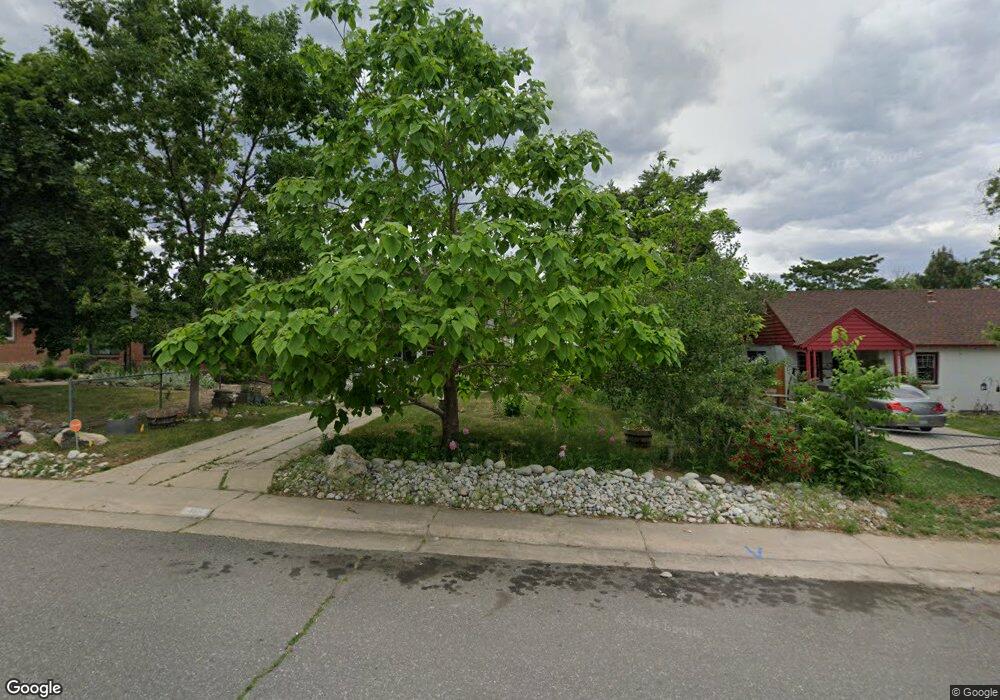
465 S Bryant St Denver, CO 80219
Athmar Park NeighborhoodEstimated Value: $439,001 - $504,000
3
Beds
2
Baths
999
Sq Ft
$480/Sq Ft
Est. Value
About This Home
This home is located at 465 S Bryant St, Denver, CO 80219 and is currently estimated at $479,250, approximately $479 per square foot. 465 S Bryant St is a home located in Denver County with nearby schools including Valverde Elementary School, Kepner Beacon Middle School, and West High School.
Ownership History
Date
Name
Owned For
Owner Type
Purchase Details
Closed on
Sep 30, 2011
Sold by
Secretary Of Housing & Urban Development
Bought by
Garcia Mayra Sanchez
Current Estimated Value
Home Financials for this Owner
Home Financials are based on the most recent Mortgage that was taken out on this home.
Original Mortgage
$95,069
Outstanding Balance
$65,679
Interest Rate
4.37%
Mortgage Type
FHA
Estimated Equity
$413,571
Purchase Details
Closed on
Jun 15, 2011
Sold by
Pnc Mortgage
Bought by
Secretary Of Housing & Urban Development
Purchase Details
Closed on
Jun 7, 2010
Sold by
Arreola Luis Armando and Ramirez Pabel
Bought by
Pnc Mortgage
Purchase Details
Closed on
Jun 2, 2000
Sold by
Ariel David
Bought by
Arreola Luis Armando and Ramirez Pabel
Home Financials for this Owner
Home Financials are based on the most recent Mortgage that was taken out on this home.
Original Mortgage
$144,036
Interest Rate
8.17%
Mortgage Type
FHA
Create a Home Valuation Report for This Property
The Home Valuation Report is an in-depth analysis detailing your home's value as well as a comparison with similar homes in the area
Home Values in the Area
Average Home Value in this Area
Purchase History
| Date | Buyer | Sale Price | Title Company |
|---|---|---|---|
| Garcia Mayra Sanchez | $95,131 | Ats | |
| Secretary Of Housing & Urban Development | -- | None Available | |
| Pnc Mortgage | -- | None Available | |
| Arreola Luis Armando | $145,000 | -- |
Source: Public Records
Mortgage History
| Date | Status | Borrower | Loan Amount |
|---|---|---|---|
| Open | Garcia Mayra Sanchez | $95,069 | |
| Previous Owner | Arreola Luis Armando | $144,036 |
Source: Public Records
Tax History Compared to Growth
Tax History
| Year | Tax Paid | Tax Assessment Tax Assessment Total Assessment is a certain percentage of the fair market value that is determined by local assessors to be the total taxable value of land and additions on the property. | Land | Improvement |
|---|---|---|---|---|
| 2024 | $2,104 | $26,570 | $8,330 | $18,240 |
| 2023 | $2,059 | $26,570 | $8,330 | $18,240 |
| 2022 | $1,900 | $23,890 | $12,470 | $11,420 |
| 2021 | $1,834 | $24,580 | $12,830 | $11,750 |
| 2020 | $1,678 | $22,610 | $7,470 | $15,140 |
| 2019 | $1,631 | $22,610 | $7,470 | $15,140 |
| 2018 | $1,388 | $17,940 | $5,640 | $12,300 |
| 2017 | $1,384 | $17,940 | $5,640 | $12,300 |
| 2016 | $1,083 | $13,280 | $4,673 | $8,607 |
| 2015 | $1,038 | $13,280 | $4,673 | $8,607 |
| 2014 | $777 | $9,350 | $2,595 | $6,755 |
Source: Public Records
Map
Nearby Homes
- 480 S Canosa Ct
- 527 S Bryant St
- 360 S Bryant St
- 326 S Alcott St
- 2251 W Custer Place
- 222 S Canosa Ct
- 601 S Dale Ct
- 695 S Bryant St
- 2120 W Custer Place
- 2141 W Gill Place
- 737 S Clay St
- 3092 W Alaska Place
- 1955 W Virginia Ave
- 118 S Dale Ct
- 3073 W Center Ave Unit A
- 3073 W Center Ave Unit C
- 1557 W Dakota Ave
- 175 S Eliot St
- 740 S Eliot St
- 1519 W Alaska Place
- 455 S Bryant St
- 475 S Bryant St
- 445 S Bryant St
- 485 S Bryant St
- 435 S Bryant St
- 464 S Bryant St
- 446 S Bryant St
- 460 S Canosa Ct
- 495 S Bryant St
- 450 S Canosa Ct
- 470 S Canosa Ct
- 470 S Bryant St
- 442 S Bryant St
- 421 S Bryant St
- 450 S Bryant St
- 490 S Canosa Ct
- 490 S Bryant St
- 436 S Canosa Ct
- 426 S Bryant St
- 417 S Bryant St