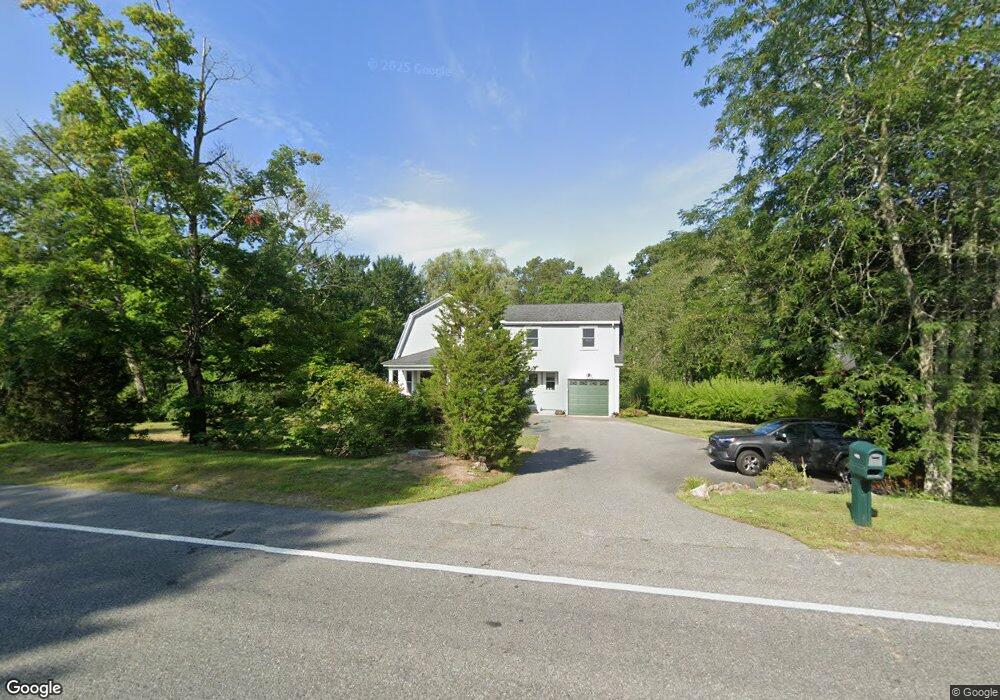
465 S Main St Andover, MA 01810
Estimated Value: $735,000 - $897,000
3
Beds
2
Baths
1,412
Sq Ft
$568/Sq Ft
Est. Value
About This Home
This home is located at 465 S Main St, Andover, MA 01810 and is currently estimated at $801,873, approximately $567 per square foot. 465 S Main St is a home located in Essex County with nearby schools including South Elementary School, Doherty Middle School, and Andover High School.
Ownership History
Date
Name
Owned For
Owner Type
Purchase Details
Closed on
Apr 5, 2024
Sold by
White Dezieck Jane F
Bought by
White-Dezieck Jane F and Dezieck James J
Current Estimated Value
Purchase Details
Closed on
Dec 28, 2011
Sold by
White Jane F and Dezieck James J
Bought by
White Jane F
Purchase Details
Closed on
Aug 27, 2004
Sold by
Berkwitt Arthur A and Berkwitt Claire M
Bought by
Dezieck James J and White Jane F
Create a Home Valuation Report for This Property
The Home Valuation Report is an in-depth analysis detailing your home's value as well as a comparison with similar homes in the area
Home Values in the Area
Average Home Value in this Area
Purchase History
| Date | Buyer | Sale Price | Title Company |
|---|---|---|---|
| White-Dezieck Jane F | -- | None Available | |
| White Jane F | -- | -- | |
| Dezieck James J | $395,500 | -- |
Source: Public Records
Tax History Compared to Growth
Tax History
| Year | Tax Paid | Tax Assessment Tax Assessment Total Assessment is a certain percentage of the fair market value that is determined by local assessors to be the total taxable value of land and additions on the property. | Land | Improvement |
|---|---|---|---|---|
| 2024 | $8,091 | $628,200 | $310,900 | $317,300 |
| 2023 | $7,841 | $574,000 | $288,100 | $285,900 |
| 2022 | $7,290 | $499,300 | $244,700 | $254,600 |
| 2021 | $6,977 | $456,300 | $222,800 | $233,500 |
| 2020 | $6,691 | $445,800 | $217,400 | $228,400 |
| 2019 | $6,604 | $432,500 | $209,100 | $223,400 |
| 2018 | $6,298 | $402,700 | $197,500 | $205,200 |
| 2017 | $6,029 | $397,200 | $193,800 | $203,400 |
| 2016 | $5,887 | $397,200 | $193,800 | $203,400 |
| 2015 | $5,657 | $377,900 | $186,300 | $191,600 |
Source: Public Records
Map
Nearby Homes
- 18 Boston Rd
- 17 Linda Rd
- 11 Gould Rd
- 21 Rocky Hill Rd
- 2 Clover Cir
- 40 Colonial Dr Unit 8
- 20 Colonial Dr Unit 3
- 1 Colonial Dr Unit C1-6
- 1 Colonial Dr Unit B1-8
- 40 Ballardvale Rd
- 9 Flash Rd
- 2 Tamys Ln
- 331 S Main St
- 24 Enfield Dr
- 10 Hillside Rd
- 11 Cogswell Rd
- 56 Sunset Rock Rd
- 3 West Hollow
- 12 Parkview Terrace
- 18 Burroughs Rd