Estimated Value: $471,000 - $591,000
3
Beds
3
Baths
1,961
Sq Ft
$263/Sq Ft
Est. Value
About This Home
This home is located at 465 Two Rivers Dr, Troy, VA 22974 and is currently estimated at $514,769, approximately $262 per square foot. 465 Two Rivers Dr is a home located in Fluvanna County with nearby schools including Central Elementary School, West Central Primary School, and Carysbrook Elementary School.
Ownership History
Date
Name
Owned For
Owner Type
Purchase Details
Closed on
Jun 10, 2015
Sold by
Dunaway Troy W and Ding Xuemei
Bought by
Ding Xuemei
Current Estimated Value
Home Financials for this Owner
Home Financials are based on the most recent Mortgage that was taken out on this home.
Original Mortgage
$326,043
Outstanding Balance
$250,898
Interest Rate
3.65%
Mortgage Type
New Conventional
Estimated Equity
$263,871
Purchase Details
Closed on
May 22, 2015
Sold by
Neade Construction Llc
Bought by
Dunaway Troy W and Ding Xuemei
Home Financials for this Owner
Home Financials are based on the most recent Mortgage that was taken out on this home.
Original Mortgage
$326,043
Outstanding Balance
$250,898
Interest Rate
3.65%
Mortgage Type
New Conventional
Estimated Equity
$263,871
Purchase Details
Closed on
May 15, 2015
Sold by
Eager Trust
Bought by
Meade Construction Llc
Home Financials for this Owner
Home Financials are based on the most recent Mortgage that was taken out on this home.
Original Mortgage
$326,043
Outstanding Balance
$250,898
Interest Rate
3.65%
Mortgage Type
New Conventional
Estimated Equity
$263,871
Create a Home Valuation Report for This Property
The Home Valuation Report is an in-depth analysis detailing your home's value as well as a comparison with similar homes in the area
Home Values in the Area
Average Home Value in this Area
Purchase History
| Date | Buyer | Sale Price | Title Company |
|---|---|---|---|
| Ding Xuemei | -- | -- | |
| Dunaway Troy W | $45,000 | -- | |
| Meade Construction Llc | $45,000 | -- |
Source: Public Records
Mortgage History
| Date | Status | Borrower | Loan Amount |
|---|---|---|---|
| Open | Dunaway Troy W | $326,043 |
Source: Public Records
Tax History Compared to Growth
Tax History
| Year | Tax Paid | Tax Assessment Tax Assessment Total Assessment is a certain percentage of the fair market value that is determined by local assessors to be the total taxable value of land and additions on the property. | Land | Improvement |
|---|---|---|---|---|
| 2025 | $3,623 | $483,100 | $50,000 | $433,100 |
| 2024 | $3,395 | $402,300 | $50,000 | $352,300 |
| 2023 | $3,395 | $402,300 | $50,000 | $352,300 |
| 2022 | $2,989 | $343,600 | $45,000 | $298,600 |
| 2021 | $2,989 | $343,600 | $45,000 | $298,600 |
| 2020 | $2,965 | $320,500 | $45,000 | $275,500 |
| 2019 | $2,965 | $320,500 | $45,000 | $275,500 |
| 2018 | $2,591 | $285,700 | $45,000 | $240,700 |
| 2017 | $2,591 | $285,700 | $45,000 | $240,700 |
| 2016 | $2,481 | $270,600 | $45,000 | $225,600 |
| 2015 | $308 | $45,000 | $45,000 | $0 |
| 2014 | $308 | $35,000 | $35,000 | $0 |
Source: Public Records
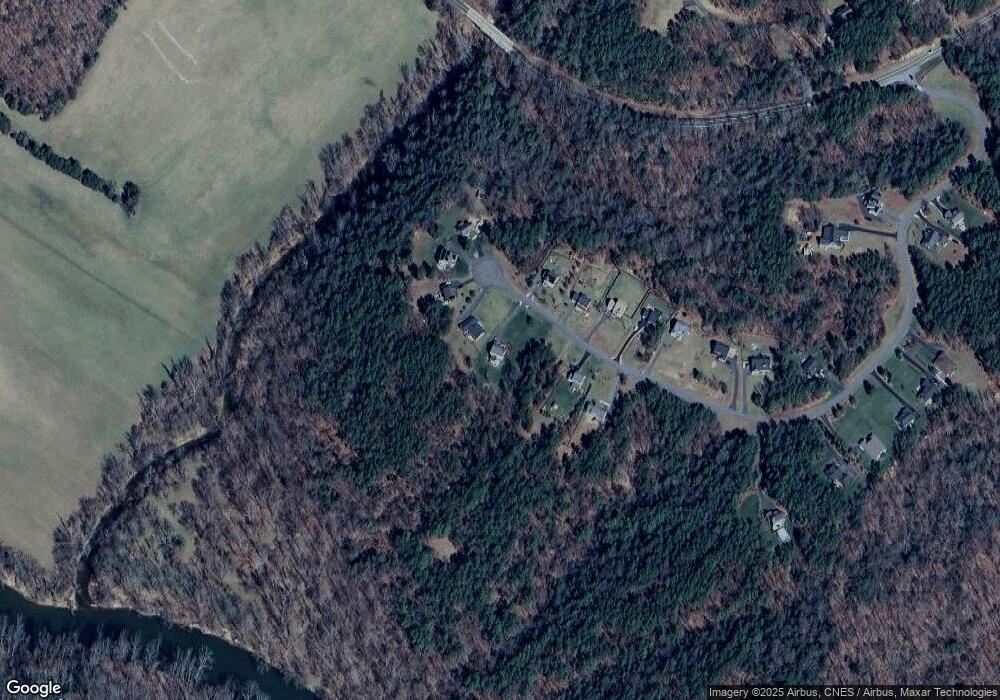
Map
Nearby Homes
- 477 Two Rivers Dr
- 13 Two Rivers Dr
- 427 Two Rivers Dr
- 436 Two Rivers Dr
- 489 Two Rivers Dr
- 462 Two Rivers Dr
- 490 Two Rivers Dr
- 399 Two Rivers Dr
- 493 Two Rivers Dr
- 422 Two Rivers Dr
- 2 Rivers Dr
- 402 Two Rivers Dr
- 18 Two Rivers Dr
- 382 Two Rivers Dr
- 334 Two Rivers Dr
- 320 Two Rivers Dr
- 0 Two Rivers Dr Unit 1006976346
- 0 Two Rivers Dr Unit FN8006351
- 321 Two Rivers Dr
- 252 Two Rivers Dr