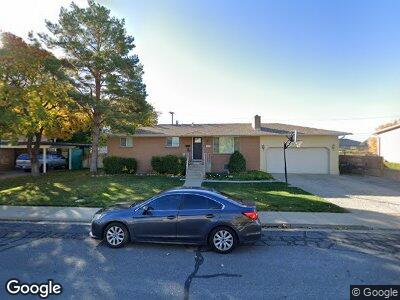
465 W 470 N Spanish Fork, UT 84660
Estimated Value: $461,000 - $476,000
4
Beds
2
Baths
1,242
Sq Ft
$378/Sq Ft
Est. Value
About This Home
This home is located at 465 W 470 N, Spanish Fork, UT 84660 and is currently estimated at $469,771, approximately $378 per square foot. 465 W 470 N is a home located in Utah County with nearby schools including Brockbank Elementary School, Spanish Fork Jr High School, and Spanish Fork High School.
Ownership History
Date
Name
Owned For
Owner Type
Purchase Details
Closed on
Apr 3, 2008
Sold by
Mickelson Jeffery B and M & J Land Trust
Bought by
Hansen Max K and Hansen Jennifer
Current Estimated Value
Purchase Details
Closed on
May 10, 2006
Sold by
Hansen Max K and Hansen Jennifer
Bought by
Mickelson Jeffery B and M & J Trust
Purchase Details
Closed on
Apr 1, 2005
Sold by
Hales Richard and Hales Teri
Bought by
Hansen Max K and Hansen Jennifer
Home Financials for this Owner
Home Financials are based on the most recent Mortgage that was taken out on this home.
Original Mortgage
$172,400
Interest Rate
5.6%
Mortgage Type
Fannie Mae Freddie Mac
Create a Home Valuation Report for This Property
The Home Valuation Report is an in-depth analysis detailing your home's value as well as a comparison with similar homes in the area
Home Values in the Area
Average Home Value in this Area
Purchase History
| Date | Buyer | Sale Price | Title Company |
|---|---|---|---|
| Hansen Max K | -- | None Available | |
| Mickelson Jeffery B | -- | None Available | |
| Hansen Max K | -- | Pro Title & Escrow Inc |
Source: Public Records
Mortgage History
| Date | Status | Borrower | Loan Amount |
|---|---|---|---|
| Open | Hansen Max K | $262,500 | |
| Closed | Hansen Max K | $214,200 | |
| Closed | Hansen Max K | $222,400 | |
| Closed | Hansen Mac K | $198,921 | |
| Closed | Hansen Jennifer | $184,843 | |
| Closed | Hansen Max K | $190,104 | |
| Closed | Hansen Max K | $188,975 | |
| Previous Owner | Hansen Max K | $172,400 |
Source: Public Records
Tax History Compared to Growth
Tax History
| Year | Tax Paid | Tax Assessment Tax Assessment Total Assessment is a certain percentage of the fair market value that is determined by local assessors to be the total taxable value of land and additions on the property. | Land | Improvement |
|---|---|---|---|---|
| 2024 | $2,034 | $209,605 | $0 | $0 |
| 2023 | $1,999 | $206,250 | $0 | $0 |
| 2022 | $2,347 | $237,545 | $0 | $0 |
| 2021 | $2,085 | $337,500 | $85,800 | $251,700 |
| 2020 | $1,895 | $298,300 | $71,500 | $226,800 |
| 2019 | $1,623 | $268,700 | $71,500 | $197,200 |
| 2018 | $1,518 | $243,000 | $71,500 | $171,500 |
| 2017 | $1,339 | $115,170 | $0 | $0 |
| 2016 | $1,241 | $105,325 | $0 | $0 |
| 2015 | $1,122 | $94,160 | $0 | $0 |
| 2014 | $1,021 | $85,965 | $0 | $0 |
Source: Public Records
Map
Nearby Homes
- 900 N 200 St W
- 691 N 300 W
- 727 N Mitchell Dr
- 145 W 500 N
- 294 W 200 N
- 279 N 200 W
- 1815 N 630 St W Unit 67
- 1841 N 630 St W Unit 71
- 380 N 100 W
- 1828 N 630 St W Unit 100
- 1787 N 630 St W
- 1788 N 630 St W Unit 47
- 1786 N 630 St W Unit 48
- 1824 N 630 St W Unit 102
- 1826 N 630 St W Unit 101
- 134 N 300 W
- 253 N 680 W
- 254 N 700 W
- 164 N 700 W
- 654 W 100 N