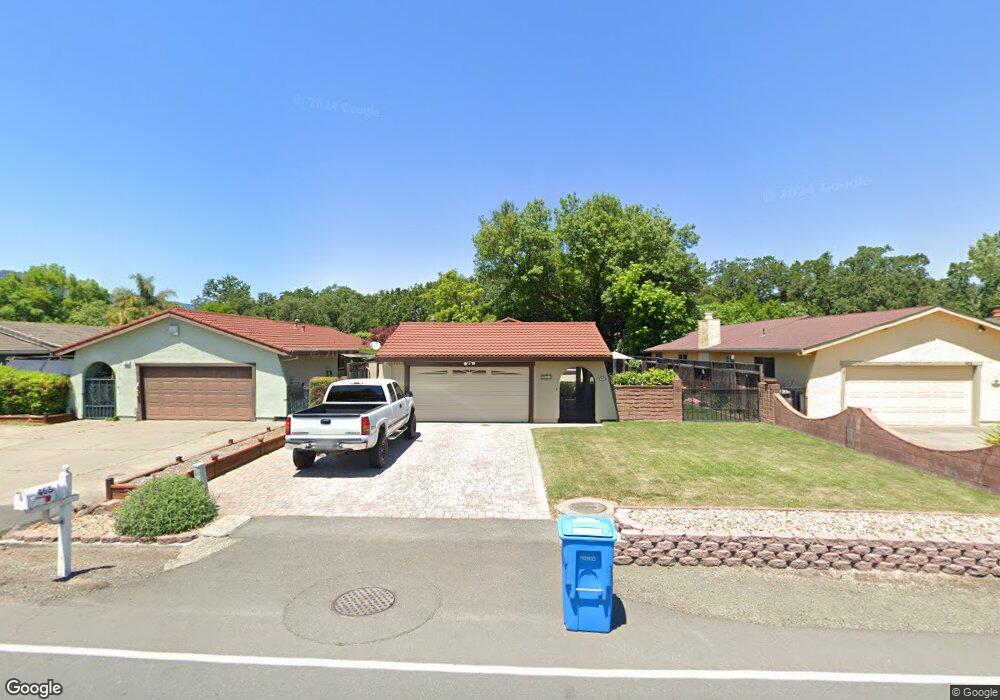
465 W Agua Caliente Rd Sonoma, CA 95476
Estimated Value: $740,000 - $1,049,000
3
Beds
2
Baths
1,334
Sq Ft
$617/Sq Ft
Est. Value
About This Home
This home is located at 465 W Agua Caliente Rd, Sonoma, CA 95476 and is currently estimated at $823,536, approximately $617 per square foot. 465 W Agua Caliente Rd is a home located in Sonoma County with nearby schools including Woodland Star Charter School, Altimira Middle School, and Creekside High School.
Ownership History
Date
Name
Owned For
Owner Type
Purchase Details
Closed on
Feb 19, 2002
Sold by
Werner James R and Welsh Donna L
Bought by
Werner James R and Welsh Donna L
Current Estimated Value
Purchase Details
Closed on
Jan 31, 2001
Sold by
Werner James
Bought by
Werner James
Home Financials for this Owner
Home Financials are based on the most recent Mortgage that was taken out on this home.
Original Mortgage
$272,000
Outstanding Balance
$98,471
Interest Rate
7.11%
Estimated Equity
$725,065
Purchase Details
Closed on
Jun 7, 2000
Sold by
Etcheverria Lorenzo and Etcheverria Grace
Bought by
Werner James and Welsh Donna
Home Financials for this Owner
Home Financials are based on the most recent Mortgage that was taken out on this home.
Original Mortgage
$228,000
Interest Rate
8.15%
Purchase Details
Closed on
Jun 6, 2000
Sold by
Werner Gretchen
Bought by
Werner James
Home Financials for this Owner
Home Financials are based on the most recent Mortgage that was taken out on this home.
Original Mortgage
$228,000
Interest Rate
8.15%
Create a Home Valuation Report for This Property
The Home Valuation Report is an in-depth analysis detailing your home's value as well as a comparison with similar homes in the area
Home Values in the Area
Average Home Value in this Area
Purchase History
| Date | Buyer | Sale Price | Title Company |
|---|---|---|---|
| Werner James R | -- | -- | |
| Werner James | -- | American Title | |
| Werner James | $285,000 | North Bay Title Co | |
| Werner James | -- | North American Title Co |
Source: Public Records
Mortgage History
| Date | Status | Borrower | Loan Amount |
|---|---|---|---|
| Open | Werner James | $272,000 | |
| Closed | Werner James | $228,000 | |
| Closed | Werner James | $42,750 |
Source: Public Records
Tax History Compared to Growth
Tax History
| Year | Tax Paid | Tax Assessment Tax Assessment Total Assessment is a certain percentage of the fair market value that is determined by local assessors to be the total taxable value of land and additions on the property. | Land | Improvement |
|---|---|---|---|---|
| 2025 | $6,308 | $438,024 | $138,316 | $299,708 |
| 2024 | $6,308 | $429,436 | $135,604 | $293,832 |
| 2023 | $6,308 | $421,017 | $132,946 | $288,071 |
| 2022 | $6,097 | $412,763 | $130,340 | $282,423 |
| 2021 | $5,964 | $404,671 | $127,785 | $276,886 |
| 2020 | $6,082 | $400,522 | $126,475 | $274,047 |
| 2019 | $5,619 | $392,670 | $123,996 | $268,674 |
| 2018 | $5,530 | $384,971 | $121,565 | $263,406 |
| 2017 | $5,385 | $377,424 | $119,182 | $258,242 |
| 2016 | $5,134 | $370,025 | $116,846 | $253,179 |
| 2015 | $5,031 | $364,468 | $115,091 | $249,377 |
| 2014 | $4,304 | $303,000 | $96,000 | $207,000 |
Source: Public Records
Map
Nearby Homes
- 133 W Agua Caliente Rd
- 280 Serres Dr
- 130 W Agua Caliente Rd
- 17190 Cedar Ave
- 80 Serres Dr
- 105 Serres Dr
- 60 Rancho Dr Unit 60
- 70 Rancho Dr
- 16936 Falcon Ln
- 155 Kearney Ave
- 265 Richards Blvd
- 227 Theodor Ln
- 150 El Portola Dr
- 311 Dechene Ave
- 49 Don Timoteo Ct
- 17364 Hillside Ave
- 298 E Agua Caliente Rd
- 17884 San Carlos Dr
- 17260 Arnold Dr
- 17285 Hillcrest Ave
- 455 W Agua Caliente Rd
- 475 W Agua Caliente Rd
- 485 W Agua Caliente Rd
- 445 W Agua Caliente Rd
- 464 Crivelli Dr
- 472 Crivelli Dr
- 452 Crivelli Dr
- 435 W Agua Caliente Rd
- 495 W Agua Caliente Rd
- 460 W Agua Caliente Rd
- 17109 Vailetti Dr
- 470 W Agua Caliente Rd
- 496 Crivelli Dr
- 425 W Agua Caliente Rd
- 432 Crivelli Dr
- 450 W Agua Caliente Rd
- 440 W Agua Caliente Rd
- 17121 Vailetti Dr
- 424 Crivelli Dr