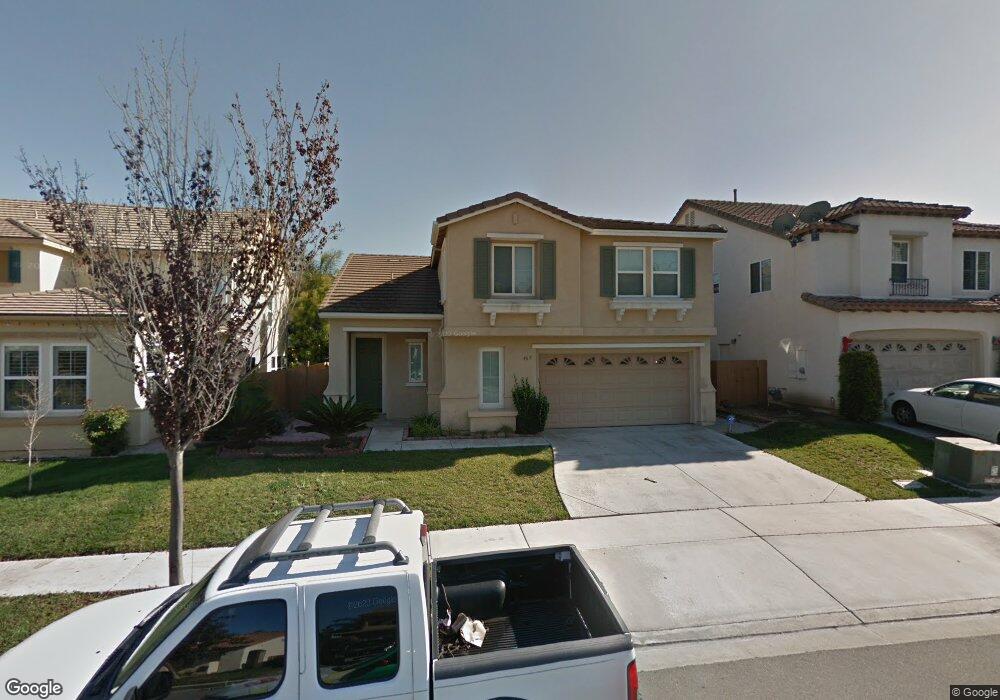
465 Whalers Ct Unit 3B San Diego, CA 92154
Ocean View Hills NeighborhoodEstimated Value: $899,684 - $1,046,000
4
Beds
3
Baths
2,159
Sq Ft
$459/Sq Ft
Est. Value
About This Home
This home is located at 465 Whalers Ct Unit 3B, San Diego, CA 92154 and is currently estimated at $990,171, approximately $458 per square foot. 465 Whalers Ct Unit 3B is a home located in San Diego County with nearby schools including Juarez Lincoln Elementary School, Montgomery Middle School, and Montgomery Senior High School.
Ownership History
Date
Name
Owned For
Owner Type
Purchase Details
Closed on
Dec 6, 2012
Sold by
Quiatchon Williardo and Quiatchon Josefina
Bought by
Xiao Yanming and Guo Yuntao
Current Estimated Value
Home Financials for this Owner
Home Financials are based on the most recent Mortgage that was taken out on this home.
Original Mortgage
$229,600
Outstanding Balance
$158,324
Interest Rate
3.27%
Mortgage Type
New Conventional
Estimated Equity
$831,847
Purchase Details
Closed on
Oct 23, 2003
Sold by
Pardee Homes
Bought by
Quiatchon Williardo and Quiatchon Josefina
Home Financials for this Owner
Home Financials are based on the most recent Mortgage that was taken out on this home.
Original Mortgage
$358,000
Interest Rate
5.62%
Mortgage Type
Unknown
Create a Home Valuation Report for This Property
The Home Valuation Report is an in-depth analysis detailing your home's value as well as a comparison with similar homes in the area
Home Values in the Area
Average Home Value in this Area
Purchase History
| Date | Buyer | Sale Price | Title Company |
|---|---|---|---|
| Xiao Yanming | $328,000 | Ticor Title Company | |
| Quiatchon Williardo | $447,500 | First American Title Co |
Source: Public Records
Mortgage History
| Date | Status | Borrower | Loan Amount |
|---|---|---|---|
| Open | Xiao Yanming | $229,600 | |
| Previous Owner | Quiatchon Williardo | $358,000 | |
| Closed | Quiatchon Williardo | $89,500 |
Source: Public Records
Tax History Compared to Growth
Tax History
| Year | Tax Paid | Tax Assessment Tax Assessment Total Assessment is a certain percentage of the fair market value that is determined by local assessors to be the total taxable value of land and additions on the property. | Land | Improvement |
|---|---|---|---|---|
| 2025 | $6,659 | $403,899 | $123,138 | $280,761 |
| 2024 | $6,659 | $395,980 | $120,724 | $275,256 |
| 2023 | $6,533 | $388,216 | $118,357 | $269,859 |
| 2022 | $6,335 | $380,605 | $116,037 | $264,568 |
| 2021 | $6,185 | $373,143 | $113,762 | $259,381 |
| 2020 | $6,035 | $369,318 | $112,596 | $256,722 |
| 2019 | $5,864 | $362,078 | $110,389 | $251,689 |
| 2018 | $5,760 | $354,979 | $108,225 | $246,754 |
| 2017 | $81 | $348,019 | $106,103 | $241,916 |
| 2016 | $5,501 | $341,196 | $104,023 | $237,173 |
| 2015 | $5,412 | $336,072 | $102,461 | $233,611 |
| 2014 | $5,314 | $329,489 | $100,454 | $229,035 |
Source: Public Records
Map
Nearby Homes
- 5353 Topsail Dr
- 5270 Topsail Dr
- 848 Makani St Unit 2
- 852 Makani St Unit 7
- 477 Vista San Lucas
- 782 Anchor Cove
- 5465 Seacliff Place Unit 76
- 1155 Ariat St Unit 2
- Anden 3 Plan at Anden at Escaya
- Anden 3X Plan at Anden at Escaya
- Anden 2 Plan at Anden at Escaya
- Anden 4X Plan at Anden at Escaya
- Anden 4 Plan at Anden at Escaya
- Anden 1 Plan at Anden at Escaya
- 5192 Emerald Cove
- 5317 Westport View Dr
- 6163 Vista Santa Catarina
- 5080 Sea Reef Place
- 951 Camino Aldea
- 1648 Pescadero Point Ct
- 459 Whalers Ct Unit 3B
- 469 Whalers Ct
- 5382 Topsail Dr
- 5376 Topsail Dr
- 455 Whalers Ct
- 475 Whalers Ct Unit 3B
- 5343 Quarterdeck Ln
- 5372 Topsail Dr
- 464 Whalers Ct
- 458 Whalers Ct
- 474 Whalers Ct Unit 3B
- 454 Whalers Ct
- 5368 Topsail Dr
- 479 Whalers Ct
- 478 Whalers Ct
- 5328 Quarterdeck Ln
- 5381 Topsail Dr
- 5385 Topsail Dr
- 5324 Quarterdeck Ln
- 5356 Topsail Dr Unit 3B