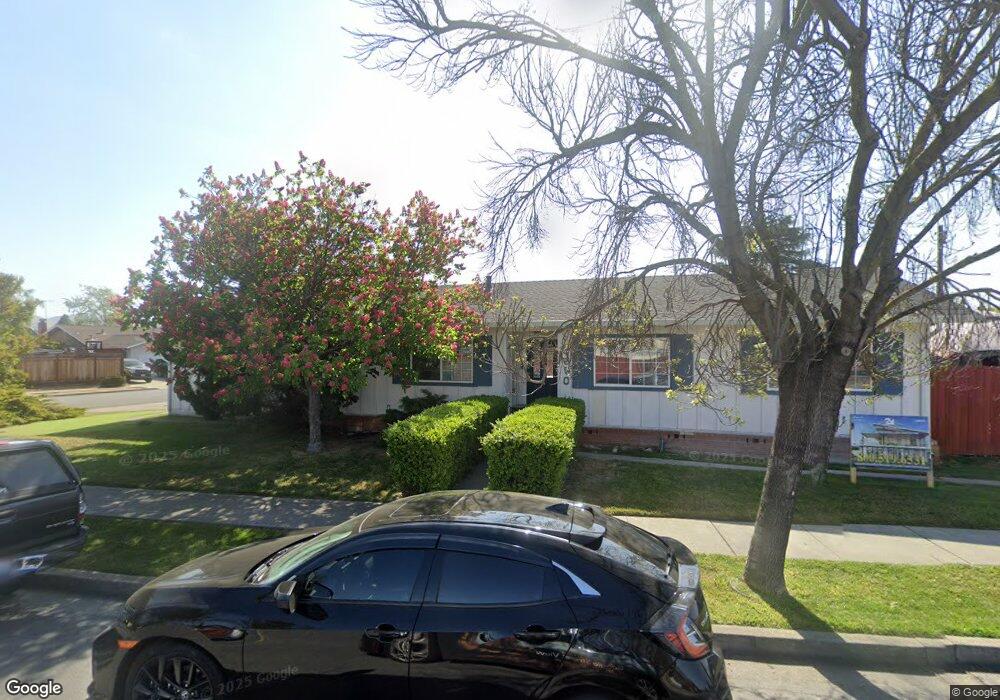
4650 Seneca Park Ave Fremont, CA 94538
Grimmer NeighborhoodEstimated Value: $1,208,000 - $1,572,000
3
Beds
2
Baths
1,455
Sq Ft
$982/Sq Ft
Est. Value
About This Home
This home is located at 4650 Seneca Park Ave, Fremont, CA 94538 and is currently estimated at $1,429,362, approximately $982 per square foot. 4650 Seneca Park Ave is a home located in Alameda County with nearby schools including Harvey Green Elementary School, John M. Horner Junior High School, and Irvington High School.
Ownership History
Date
Name
Owned For
Owner Type
Purchase Details
Closed on
Sep 18, 2020
Sold by
Garcia Virinder and Pelayo Robert James
Bought by
Garcia Virinder and Garcha Ajmit
Current Estimated Value
Home Financials for this Owner
Home Financials are based on the most recent Mortgage that was taken out on this home.
Original Mortgage
$450,000
Outstanding Balance
$399,345
Interest Rate
2.9%
Mortgage Type
New Conventional
Estimated Equity
$1,030,017
Purchase Details
Closed on
Dec 18, 2013
Sold by
Pelayo Robert J and Garcha Ajmit K
Bought by
Carpio Virinder Kaur and Pelayo Robert James
Home Financials for this Owner
Home Financials are based on the most recent Mortgage that was taken out on this home.
Original Mortgage
$335,000
Interest Rate
4.32%
Mortgage Type
New Conventional
Purchase Details
Closed on
Oct 9, 1998
Sold by
Garcha Ajmit K
Bought by
Pelayo Robert J and Garcha Ajmit K
Create a Home Valuation Report for This Property
The Home Valuation Report is an in-depth analysis detailing your home's value as well as a comparison with similar homes in the area
Home Values in the Area
Average Home Value in this Area
Purchase History
| Date | Buyer | Sale Price | Title Company |
|---|---|---|---|
| Garcia Virinder | $150,000 | Fidelity National Title | |
| Carpio Virinder Kaur | $111,663 | Chicago Title Company | |
| Pelayo Robert J | $75,500 | -- |
Source: Public Records
Mortgage History
| Date | Status | Borrower | Loan Amount |
|---|---|---|---|
| Open | Garcia Virinder | $450,000 | |
| Previous Owner | Carpio Virinder Kaur | $335,000 |
Source: Public Records
Tax History Compared to Growth
Tax History
| Year | Tax Paid | Tax Assessment Tax Assessment Total Assessment is a certain percentage of the fair market value that is determined by local assessors to be the total taxable value of land and additions on the property. | Land | Improvement |
|---|---|---|---|---|
| 2025 | $3,503 | $240,954 | $94,386 | $146,568 |
| 2024 | $3,503 | $236,231 | $92,536 | $143,695 |
| 2023 | $3,394 | $231,599 | $90,722 | $140,877 |
| 2022 | $3,328 | $227,058 | $88,943 | $138,115 |
| 2021 | $3,253 | $222,606 | $87,199 | $135,407 |
| 2020 | $3,187 | $220,324 | $86,305 | $134,019 |
| 2019 | $3,155 | $216,005 | $84,613 | $131,392 |
| 2018 | $3,092 | $211,770 | $82,954 | $128,816 |
| 2017 | $3,016 | $207,618 | $81,328 | $126,290 |
| 2016 | $2,953 | $203,547 | $79,733 | $123,814 |
| 2015 | $2,903 | $200,491 | $78,536 | $121,955 |
| 2014 | $2,846 | $196,565 | $76,998 | $119,567 |
Source: Public Records
Map
Nearby Homes
- 42932 Peachwood St
- 4537 Capewood Terrace
- 4533 Capewood Terrace
- 43163 Grimmer Terrace
- 4860 Bryce Canyon Park Dr
- 4309 Bora Ave
- 41882 Gifford St
- 48 Eagle Green
- 92 Delta Green
- 5341 Audubon Park Ct
- 4751 Wadsworth Ct
- 262 Manitoba Green
- 202 Manitoba Terrace
- 40696 Robin St
- 208 Manitoba Terrace
- 261 Manitoba Green Unit 261
- 257 Manitoba Green
- 3923 Wildflower Common Unit 19
- 42759 Newport Dr
- 3872 Wildflower Common Unit 27
- 42623 Shoreham Park Ct
- 4718 Seneca Park Ave
- 4721 Valpey Park Ave
- 42625 Shoreham Park Ct
- 4550 Seneca Park Ave
- 4621 Seneca Park Ave
- 42622 Shoreham Park Ct
- 4591 Seneca Park Ave
- 42624 Shoreham Park Ct
- 4723 Valpey Park Ave
- 4701 Seneca Park Ave
- 4720 Seneca Park Ave
- 4571 Seneca Park Ave
- 42628 Shoreham Park Ct
- 42633 Shoreham Park Ct
- 4540 Seneca Park Ave
- 4551 Seneca Park Ave
- 4706 Valpey Park Ave
- 42630 Shoreham Park Ct
- 4698 Victoria Park Ct