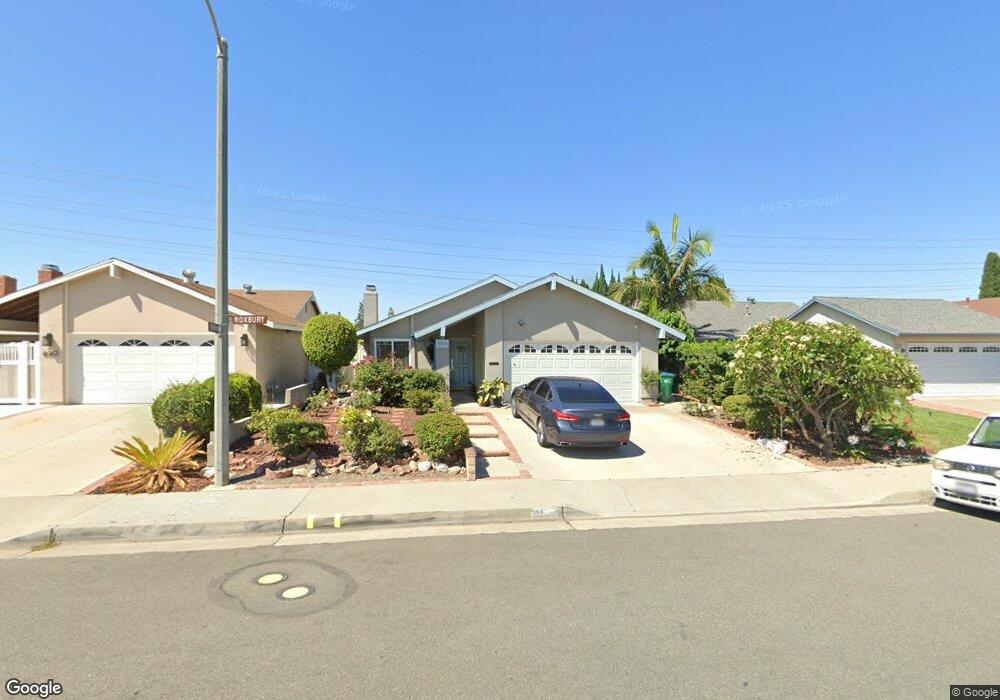
4652 Roxbury Dr Irvine, CA 92604
Walnut NeighborhoodEstimated Value: $1,098,000 - $1,242,000
About This Home
This home is located at 4652 Roxbury Dr, Irvine, CA 92604 and is currently estimated at $1,191,788, approximately $1,067 per square foot. 4652 Roxbury Dr is a home located in Orange County with nearby schools including Greentree Elementary School, Venado Middle School, and Irvine High School.
Ownership History
We collect this data history from publicly available records. To have your information removed, we recommend requesting removal directly through your county’s website.
Purchase Details
Purchase Details
Home Financials for this Owner
Home Financials are based on the most recent Mortgage that was taken out on this home.Purchase Details
Home Financials for this Owner
Home Financials are based on the most recent Mortgage that was taken out on this home.Purchase Details
Home Financials for this Owner
Home Financials are based on the most recent Mortgage that was taken out on this home.Purchase Details
Home Financials for this Owner
Home Financials are based on the most recent Mortgage that was taken out on this home.Purchase Details
Purchase Details
Home Financials for this Owner
Home Financials are based on the most recent Mortgage that was taken out on this home.Purchase Details
Purchase Details
Home Financials for this Owner
Home Financials are based on the most recent Mortgage that was taken out on this home.Purchase Details
Home Financials for this Owner
Home Financials are based on the most recent Mortgage that was taken out on this home.Purchase Details
Home Financials for this Owner
Home Financials are based on the most recent Mortgage that was taken out on this home.Purchase Details
Home Financials for this Owner
Home Financials are based on the most recent Mortgage that was taken out on this home.Purchase Details
Home Values in the Area
Average Home Value in this Area
Purchase History
We collect this data history from publicly available records. To have your information removed, we recommend requesting removal directly through your county’s website.
| Date | Buyer | Sale Price | Title Company |
|---|---|---|---|
| -- | None Available | ||
| -- | None Available | ||
| -- | Wfg Title Company | ||
| -- | Accommodation | ||
| -- | None Available | ||
| -- | None Available | ||
| -- | Pacific Coast Title Company | ||
| -- | Pacific Coast Title Company | ||
| -- | None Available | ||
| -- | Nations Title | ||
| -- | Accommodation | ||
| -- | Landwood Title Company | ||
| -- | None Available | ||
| -- | Orange Coast Title | ||
| -- | Fidelity National Title Ins | ||
| $154,000 | Chicago Title Co |
Mortgage History
We collect this data history from publicly available records. To have your information removed, we recommend requesting removal directly through your county’s website.
| Date | Status | Borrower | Loan Amount |
|---|---|---|---|
| Open | $250,000 | ||
| Closed | $356,000 | ||
| Closed | $125,000 | ||
| Closed | $395,000 | ||
| Closed | $90,000 | ||
| Closed | $378,400 | ||
| Closed | $300,000 | ||
| Closed | $320,000 | ||
| Closed | $320,000 | ||
| Closed | $345,000 | ||
| Closed | $250,000 | ||
| Closed | $250,000 | ||
| Closed | $165,000 | ||
| Closed | $100,000 | ||
| Closed | $150,000 |
Tax History
We collect this data history from publicly available records. To have your information removed, we recommend requesting removal directly through your county’s website.
| Year | Tax Paid | Tax Assessment Tax Assessment Total Assessment is a certain percentage of the fair market value that is determined by local assessors to be the total taxable value of land and additions on the property. | Land | Improvement |
|---|---|---|---|---|
| 2025 | $2,747 | $255,820 | $160,051 | $95,769 |
| 2024 | $2,747 | $250,804 | $156,912 | $93,892 |
| 2023 | $2,674 | $245,887 | $153,836 | $92,051 |
| 2022 | $2,616 | $241,066 | $150,819 | $90,247 |
| 2021 | $2,552 | $236,340 | $147,862 | $88,478 |
| 2020 | $2,537 | $233,917 | $146,346 | $87,571 |
| 2019 | $2,479 | $229,331 | $143,477 | $85,854 |
| 2018 | $2,432 | $224,835 | $140,664 | $84,171 |
| 2017 | $2,380 | $220,427 | $137,906 | $82,521 |
| 2016 | $2,279 | $216,105 | $135,202 | $80,903 |
| 2015 | $2,244 | $212,859 | $133,171 | $79,688 |
| 2014 | $2,201 | $208,690 | $130,562 | $78,128 |
Map
- 15 Snapdragon Unit 8
- 2 Snapdragon
- 12 Silverwood Unit 19
- 4652 Charnock Dr
- 9 Badger Pass
- 4382 Skylark St
- 32 Deerwood E
- 5 Deer Creek
- 8 Fuchsia Unit 42
- 4512 Robinwood Cir
- 4600 Rivington
- 4821 Lori Ann Ln
- 13 Sunflower
- 2 Sunflower Unit 29
- 4462 Walnut Ave
- 5131 Greencap Ave
- 14862 Rattan St
- 4141 Pleasant St
- 34 Elksford Ave Unit 3
- 4122 Loma St
- 4662 Roxbury Dr
- 4642 Roxbury Dr
- 4672 Roxbury Dr
- 4636 Roxbury Dr
- 4682 Roxbury Dr
- 4632 Roxbury Dr
- 14951 Burnham Cir
- 14952 Burnham Cir
- 4692 Roxbury Dr
- 4622 Roxbury Dr
- 14941 Burnham Cir
- 14952 Gainford Cir
- 14942 Burnham Cir
- 4702 Roxbury Dr
- 4612 Roxbury Dr
- 14931 Burnham Cir
- 14942 Gainford Cir
- 14951 Waverly Ln
- 14932 Burnham Cir
- 14932 Gainford Cir
Ask me questions while you tour the home.