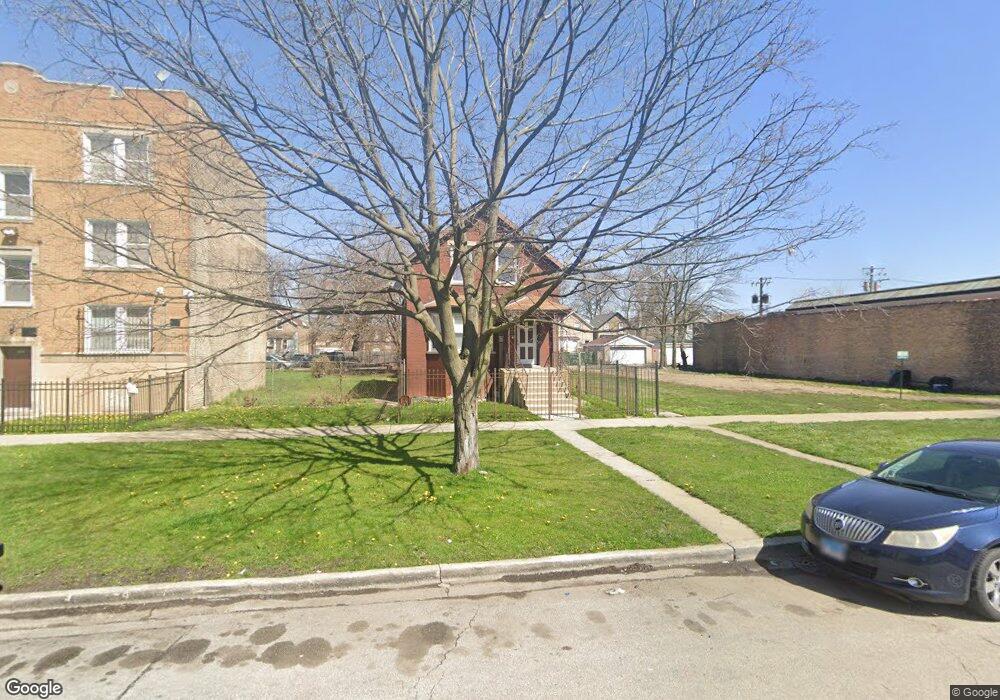
4652 W Maypole Ave Chicago, IL 60644
Garfield Park NeighborhoodEstimated Value: $109,000 - $191,000
3
Beds
2
Baths
1,029
Sq Ft
$148/Sq Ft
Est. Value
About This Home
This home is located at 4652 W Maypole Ave, Chicago, IL 60644 and is currently estimated at $152,205, approximately $147 per square foot. 4652 W Maypole Ave is a home located in Cook County with nearby schools including Tilton Elementary School, Marshall Metropolitan High School, and The Field School.
Ownership History
Date
Name
Owned For
Owner Type
Purchase Details
Closed on
Dec 23, 2003
Sold by
Kinsey Henry and Kinsey Annie L
Bought by
Brown Donald
Current Estimated Value
Home Financials for this Owner
Home Financials are based on the most recent Mortgage that was taken out on this home.
Original Mortgage
$104,069
Outstanding Balance
$48,325
Interest Rate
5.91%
Mortgage Type
FHA
Estimated Equity
$103,880
Purchase Details
Closed on
Aug 7, 2002
Sold by
Kinsey Henry and Alexander Emma
Bought by
Kinsey Henry and Kinsey Annie L
Home Financials for this Owner
Home Financials are based on the most recent Mortgage that was taken out on this home.
Original Mortgage
$70,400
Interest Rate
9.62%
Purchase Details
Closed on
Jun 27, 2002
Sold by
Kinsey Henry
Bought by
Kinsey Henry and Alexander Emma
Home Financials for this Owner
Home Financials are based on the most recent Mortgage that was taken out on this home.
Original Mortgage
$70,400
Interest Rate
9.62%
Purchase Details
Closed on
Apr 3, 2002
Sold by
Alexander Emma
Bought by
Kinsey Henry
Create a Home Valuation Report for This Property
The Home Valuation Report is an in-depth analysis detailing your home's value as well as a comparison with similar homes in the area
Home Values in the Area
Average Home Value in this Area
Purchase History
| Date | Buyer | Sale Price | Title Company |
|---|---|---|---|
| Brown Donald | $105,000 | Multiple | |
| Kinsey Henry | -- | -- | |
| Kinsey Henry | -- | -- | |
| Kinsey Henry | -- | Greater Illinois Title Compa |
Source: Public Records
Mortgage History
| Date | Status | Borrower | Loan Amount |
|---|---|---|---|
| Open | Brown Donald | $104,069 | |
| Previous Owner | Kinsey Henry | $70,400 |
Source: Public Records
Tax History Compared to Growth
Tax History
| Year | Tax Paid | Tax Assessment Tax Assessment Total Assessment is a certain percentage of the fair market value that is determined by local assessors to be the total taxable value of land and additions on the property. | Land | Improvement |
|---|---|---|---|---|
| 2024 | $144 | $11,000 | $3,915 | $7,085 |
| 2023 | $119 | $4,000 | $2,121 | $1,879 |
| 2022 | $119 | $4,000 | $2,121 | $1,879 |
| 2021 | $135 | $4,000 | $2,122 | $1,878 |
| 2020 | $1,049 | $7,813 | $3,172 | $4,641 |
| 2019 | $1,055 | $8,682 | $3,172 | $5,510 |
| 2018 | $1,036 | $8,682 | $3,172 | $5,510 |
| 2017 | $1,202 | $8,957 | $2,835 | $6,122 |
| 2016 | $1,294 | $8,957 | $2,835 | $6,122 |
| 2015 | $869 | $8,957 | $2,835 | $6,122 |
| 2014 | $941 | $7,643 | $2,700 | $4,943 |
| 2013 | $912 | $7,643 | $2,700 | $4,943 |
Source: Public Records
Map
Nearby Homes
- 4718 W Maypole Ave
- 223 N Kolmar Ave
- 4501 W Maypole Ave
- 4543 W West End Ave
- 4720 W Washington Blvd
- 231 N La Crosse Ave
- 257 N Kilbourn Ave
- 4432 W Maypole Ave
- 155 N La Crosse Ave
- 206 N La Crosse Ave
- 4810 W Washington Blvd
- 201 N Lamon Ave
- 4407 W Maypole Ave
- 4818 W Washington Blvd
- 217 N Kostner Ave
- 4821 W Washington Blvd
- 4456 W Madison St
- 4918 W Fulton St
- 4626 W Monroe St
- 4704 W Monroe St
- 4650 W Maypole Ave Unit 2
- 4656 W Maypole Ave
- 4646 W Maypole Ave Unit 1
- 4646 W Maypole Ave
- 4653 W Fulton St
- 4649 W Fulton St
- 4658 W Maypole Ave
- 4651 W Fulton St
- 4647 W Fulton St
- 4661 W Fulton St
- 4643 W Fulton St
- 4659 W Fulton St
- 4665 W Fulton St
- 4641 W Fulton St
- 4639 W Fulton St
- 4700 W Maypole Ave
- 4637 W Fulton St
- 4630 W Maypole Ave
- 4702 W Maypole Ave
- 4628 W Maypole Ave