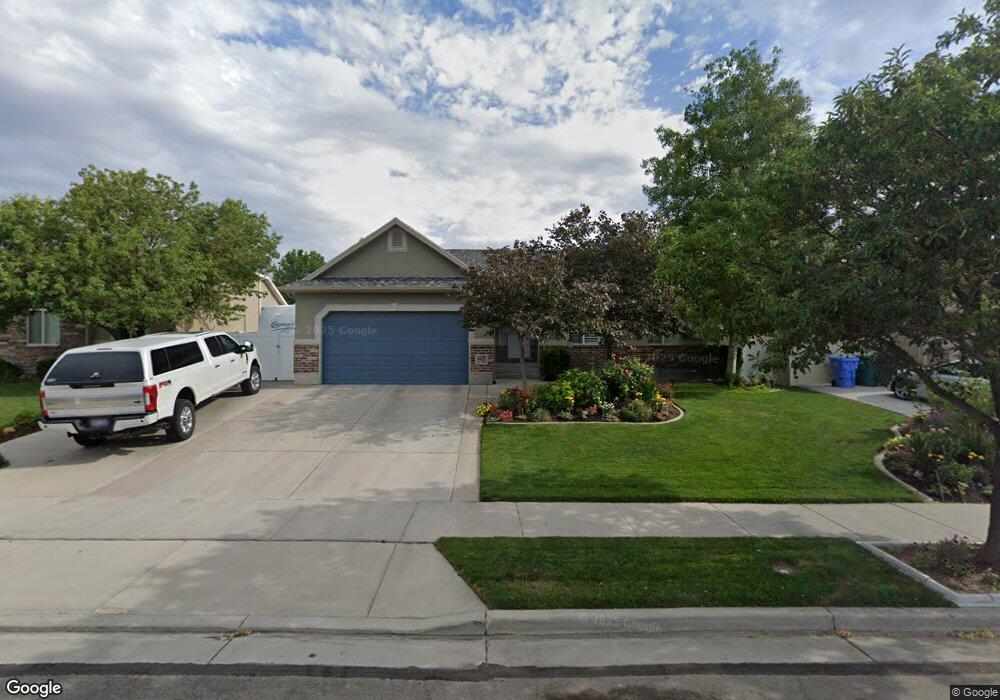
4652 Zia Ct Riverton, UT 84096
Estimated Value: $591,000 - $618,000
3
Beds
2
Baths
1,560
Sq Ft
$386/Sq Ft
Est. Value
About This Home
This home is located at 4652 Zia Ct, Riverton, UT 84096 and is currently estimated at $601,958, approximately $385 per square foot. 4652 Zia Ct is a home located in Salt Lake County with nearby schools including Midas Creek Elementary School, South Hills Middle School, and Mountain Ridge High School.
Ownership History
Date
Name
Owned For
Owner Type
Purchase Details
Closed on
Mar 28, 2019
Sold by
Searle Cory and Bond Torrie
Bought by
Searle Cory C and Bond Torrie
Current Estimated Value
Purchase Details
Closed on
May 15, 2007
Sold by
Searle Cory and Searle Joyce
Bought by
Searle Cory
Home Financials for this Owner
Home Financials are based on the most recent Mortgage that was taken out on this home.
Original Mortgage
$242,700
Outstanding Balance
$147,627
Interest Rate
6.17%
Mortgage Type
New Conventional
Estimated Equity
$454,331
Purchase Details
Closed on
Jan 16, 2004
Sold by
Perry Homes Utah Inc
Bought by
Searle Cory and Searle Joyce
Home Financials for this Owner
Home Financials are based on the most recent Mortgage that was taken out on this home.
Original Mortgage
$142,900
Interest Rate
6.02%
Mortgage Type
Purchase Money Mortgage
Create a Home Valuation Report for This Property
The Home Valuation Report is an in-depth analysis detailing your home's value as well as a comparison with similar homes in the area
Home Values in the Area
Average Home Value in this Area
Purchase History
| Date | Buyer | Sale Price | Title Company |
|---|---|---|---|
| Searle Cory C | -- | None Available | |
| Searle Cory | -- | Us Title Of Utah | |
| Searle Cory | -- | Meridian Title | |
| Perry Homes Utah Inc | -- | Meridian Title |
Source: Public Records
Mortgage History
| Date | Status | Borrower | Loan Amount |
|---|---|---|---|
| Open | Searle Cory | $242,700 | |
| Closed | Searle Cory | $142,900 | |
| Closed | Searle Cory | $35,750 |
Source: Public Records
Tax History Compared to Growth
Tax History
| Year | Tax Paid | Tax Assessment Tax Assessment Total Assessment is a certain percentage of the fair market value that is determined by local assessors to be the total taxable value of land and additions on the property. | Land | Improvement |
|---|---|---|---|---|
| 2025 | $3,181 | $568,500 | $153,000 | $415,500 |
| 2024 | $3,181 | $550,500 | $148,300 | $402,200 |
| 2023 | $3,181 | $528,600 | $146,700 | $381,900 |
| 2022 | $3,347 | $535,800 | $143,800 | $392,000 |
| 2021 | $2,742 | $390,800 | $116,900 | $273,900 |
| 2020 | $2,600 | $345,500 | $93,500 | $252,000 |
| 2019 | $2,617 | $341,800 | $93,500 | $248,300 |
| 2018 | $2,479 | $318,800 | $90,600 | $228,200 |
| 2017 | $2,378 | $298,000 | $90,600 | $207,400 |
| 2016 | $2,264 | $272,300 | $90,600 | $181,700 |
| 2015 | $2,267 | $264,300 | $92,300 | $172,000 |
| 2014 | $2,179 | $249,100 | $88,000 | $161,100 |
Source: Public Records
Map
Nearby Homes
- 12801 Stormy Meadow Dr
- 4478 W Mandy Lee Cove
- 12779 S Snow Flower Ct
- 12630 S Alpine Lake Ln Unit 202
- 4967 W Berry Creek Dr
- 12531 S Huron Rd
- 5002 W Ticoa Ln
- 4933 W Pillar Dr
- 13032 S Tortola Dr Unit 201
- 12988 S Cohab Canyon Ct
- 4768 W Liberation Dr
- 4243 W Park Lake Ct
- 12644 S Quail Lake Dr
- 4758 Wagon Train Dr
- 4248 W Yuba Park Ct
- 4587 W Flintlock Way
- 4494 W Osage Rd
- 4206 W Dead Horse Ct Unit 481
- 13221 S Dominica Ln Unit 303
- 13526 S Poole Dr Unit 301