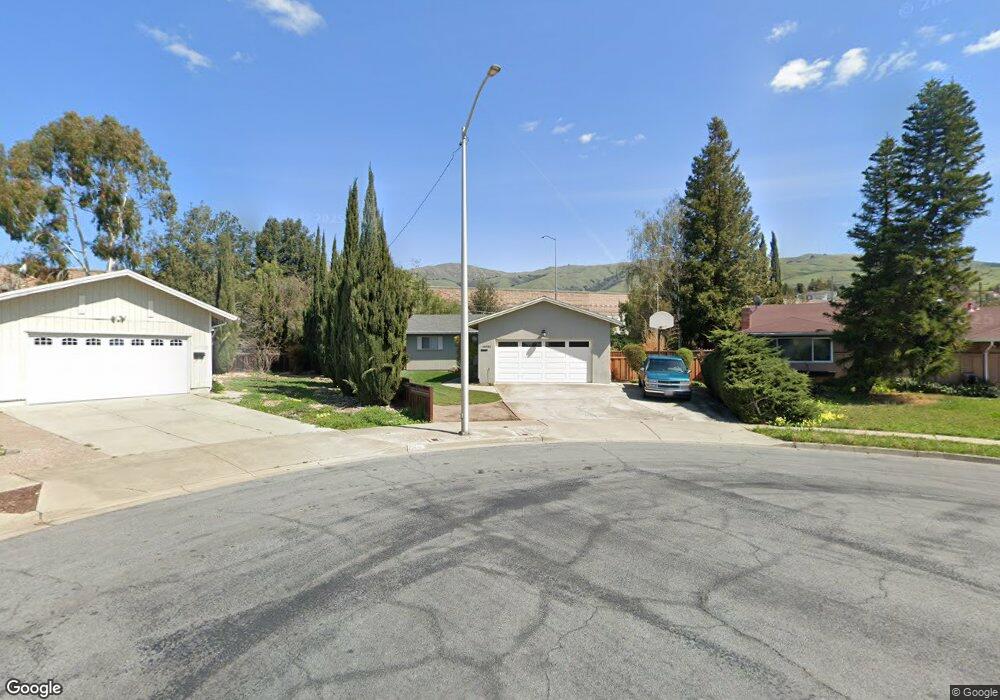
46526 Bradley Ct Fremont, CA 94539
Warm Springs NeighborhoodEstimated Value: $1,661,756 - $2,088,000
3
Beds
2
Baths
1,430
Sq Ft
$1,275/Sq Ft
Est. Value
About This Home
This home is located at 46526 Bradley Ct, Fremont, CA 94539 and is currently estimated at $1,822,939, approximately $1,274 per square foot. 46526 Bradley Ct is a home located in Alameda County with nearby schools including James Leitch Elementary School, Warm Springs Elementary School, and John M. Horner Junior High School.
Ownership History
Date
Name
Owned For
Owner Type
Purchase Details
Closed on
Sep 13, 2017
Sold by
Lau Wai Kin and Lo Mandy
Bought by
Lau Wai Kin and Lo Mandy
Current Estimated Value
Purchase Details
Closed on
Jan 13, 1998
Sold by
Nance Stephen A and Nance Rosanna
Bought by
Nance Stephen A
Create a Home Valuation Report for This Property
The Home Valuation Report is an in-depth analysis detailing your home's value as well as a comparison with similar homes in the area
Home Values in the Area
Average Home Value in this Area
Purchase History
| Date | Buyer | Sale Price | Title Company |
|---|---|---|---|
| Lau Wai Kin | -- | None Available | |
| Nance Stephen A | -- | -- |
Source: Public Records
Tax History Compared to Growth
Tax History
| Year | Tax Paid | Tax Assessment Tax Assessment Total Assessment is a certain percentage of the fair market value that is determined by local assessors to be the total taxable value of land and additions on the property. | Land | Improvement |
|---|---|---|---|---|
| 2025 | $3,904 | $277,232 | $143,360 | $140,872 |
| 2024 | $3,904 | $271,659 | $140,549 | $138,110 |
| 2023 | $3,784 | $273,196 | $137,794 | $135,402 |
| 2022 | $3,712 | $260,839 | $135,092 | $132,747 |
| 2021 | $3,626 | $255,589 | $132,444 | $130,145 |
| 2020 | $3,565 | $259,897 | $131,086 | $128,811 |
| 2019 | $3,527 | $254,801 | $128,516 | $126,285 |
| 2018 | $3,455 | $249,805 | $125,996 | $123,809 |
| 2017 | $3,368 | $244,908 | $123,526 | $121,382 |
| 2016 | $3,299 | $240,108 | $121,105 | $119,003 |
| 2015 | $3,244 | $236,502 | $119,286 | $117,216 |
| 2014 | $3,179 | $231,870 | $116,950 | $114,920 |
Source: Public Records
Map
Nearby Homes
- 46869 Fernald Common Unit 38
- 46935 Aloe Ct
- 46925 Aloe Ct
- 524 E Warren Ave
- 46762 Winema Common
- 45897 Bridgeport Place
- 199 E Warren Common
- 281 Hackamore Common
- 130 Kootenai Dr
- 47236 Cavanaugh Common
- 136 Hackamore Ln Unit 18
- 114 Hackamore Ln Unit 14
- 47222 Mission Falls Ct
- 1748 Kilowatt Way Unit 301
- 2250 Kilowatt Way Unit 214
- 45258 Tom Blalock St Unit 100
- 45128 Warm Springs Blvd Unit 323
- 45128 Warm Springs Blvd Unit 523
- 1910 Vinehill Cir
- 44916 Winding Ln
- 46544 Bradley Ct
- 46508 Bradley Ct
- 46562 Bradley Ct
- 46601 Crawford Ct
- 46509 Bradley Ct
- 46635 Crawford Ct
- 46580 Bradley Ct
- 46527 Bradley Ct
- 46545 Bradley Ct
- 46600 Crawford Ct
- 46563 Bradley Ct
- 46752 Crawford St
- 46746 Crawford St
- 46758 Crawford St
- 46581 Bradley Ct
- 46634 Crawford Ct
- 46599 Bradley Ct
- 46668 Crawford Ct
- 46698 Crawford Ct
- 46751 Crawford St