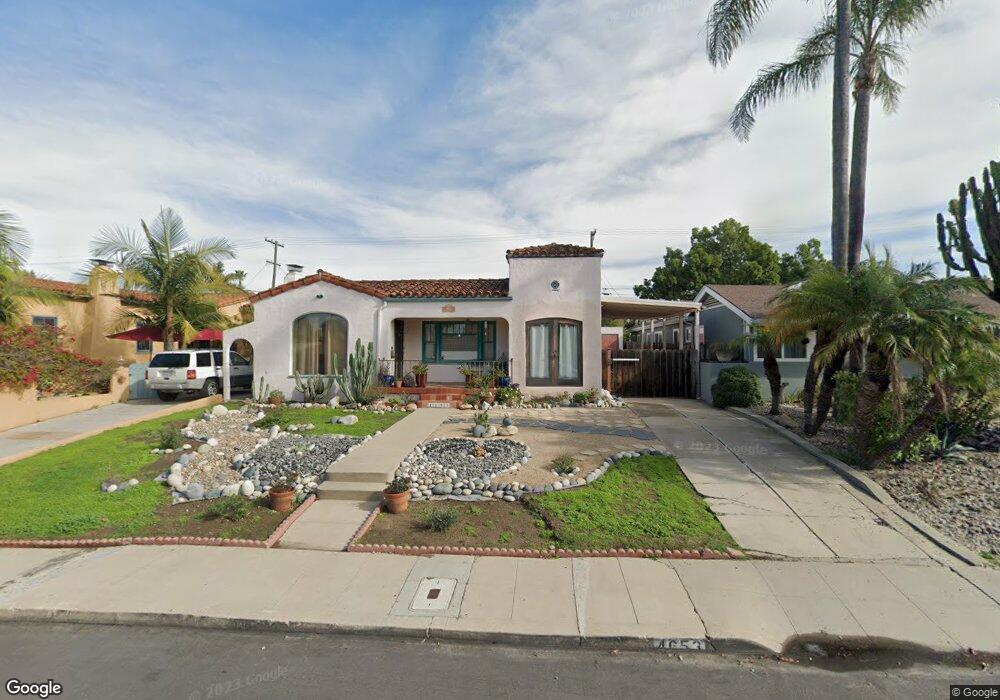
4653 Alice St San Diego, CA 92115
College West NeighborhoodEstimated Value: $931,000 - $1,090,000
3
Beds
1
Bath
1,431
Sq Ft
$705/Sq Ft
Est. Value
About This Home
This home is located at 4653 Alice St, San Diego, CA 92115 and is currently estimated at $1,009,501, approximately $705 per square foot. 4653 Alice St is a home located in San Diego County with nearby schools including Fay Elementary School, Mann Middle School, and Crawford High School.
Ownership History
Date
Name
Owned For
Owner Type
Purchase Details
Closed on
Feb 25, 2021
Sold by
Laskowski Frederick and Laskowski Theresa
Bought by
Laskowski Fred and Laskowski Theresa
Current Estimated Value
Home Financials for this Owner
Home Financials are based on the most recent Mortgage that was taken out on this home.
Original Mortgage
$300,000
Outstanding Balance
$222,365
Interest Rate
2.7%
Mortgage Type
New Conventional
Estimated Equity
$787,136
Purchase Details
Closed on
Jul 30, 2014
Sold by
Laskowski Fred and Laskowski Theresa
Bought by
The Laskowski Family Trust and Laskowski Theresa
Purchase Details
Closed on
Apr 24, 2002
Sold by
Rocks Kenneth J and Rocks Mary Vistor
Bought by
Laskowski Fred and Laskowski Theresa
Home Financials for this Owner
Home Financials are based on the most recent Mortgage that was taken out on this home.
Original Mortgage
$294,000
Interest Rate
7.13%
Create a Home Valuation Report for This Property
The Home Valuation Report is an in-depth analysis detailing your home's value as well as a comparison with similar homes in the area
Home Values in the Area
Average Home Value in this Area
Purchase History
| Date | Buyer | Sale Price | Title Company |
|---|---|---|---|
| Laskowski Fred | -- | Western Resources Title | |
| Laskowski Frederick | -- | Western Resources Title | |
| The Laskowski Family Trust | -- | None Available | |
| Laskowski Fred | $367,500 | American Title Ins Co |
Source: Public Records
Mortgage History
| Date | Status | Borrower | Loan Amount |
|---|---|---|---|
| Open | Laskowski Frederick | $300,000 | |
| Closed | Laskowski Fred | $294,000 | |
| Closed | Laskowski Fred | $55,125 |
Source: Public Records
Tax History Compared to Growth
Tax History
| Year | Tax Paid | Tax Assessment Tax Assessment Total Assessment is a certain percentage of the fair market value that is determined by local assessors to be the total taxable value of land and additions on the property. | Land | Improvement |
|---|---|---|---|---|
| 2025 | $6,485 | $542,890 | $241,270 | $301,620 |
| 2024 | $6,485 | $532,246 | $236,540 | $295,706 |
| 2023 | $6,340 | $521,810 | $231,902 | $289,908 |
| 2022 | $6,170 | $511,579 | $227,355 | $284,224 |
| 2021 | $6,127 | $501,549 | $222,898 | $278,651 |
| 2020 | $6,052 | $496,407 | $220,613 | $275,794 |
| 2019 | $5,942 | $486,675 | $216,288 | $270,387 |
| 2018 | $5,555 | $477,134 | $212,048 | $265,086 |
| 2017 | $80 | $467,780 | $207,891 | $259,889 |
| 2016 | $5,333 | $458,609 | $203,815 | $254,794 |
| 2015 | $5,253 | $451,721 | $200,754 | $250,967 |
| 2014 | $5,169 | $442,873 | $196,822 | $246,051 |
Source: Public Records
Map
Nearby Homes
- 5740 Adams Ave
- 4649 60th St
- 4866 Barbarossa Place
- 4733 Soria Dr
- 4560 60th St Unit 11
- 5885 El Cajon Blvd Unit 301
- 5885 El Cajon Blvd Unit 214
- 5885 El Cajon Blvd Unit 204
- 4540 60th St Unit 303
- 4540 60th St Unit 211
- 5640 Campanile Way
- 5895 Estelle St
- 4926 Cresita Dr
- 4515 College Way Unit P
- 5488 New Mills Rd
- 5550 Adelaide Ave Unit 11
- 5556 Baja Dr
- 5510 Adelaide Ave Unit 1
- 5511 Adelaide Ave Unit 29
- 5643 Meade Ave