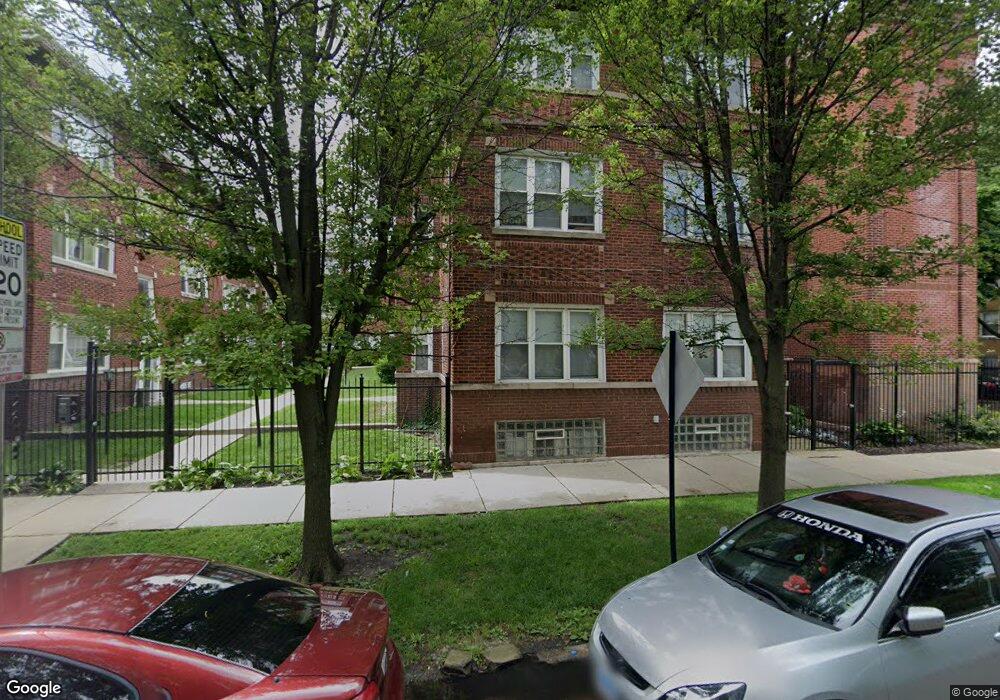
4654 N Saint Louis Ave Unit 4654 Chicago, IL 60625
Albany Park NeighborhoodEstimated Value: $193,000 - $206,000
--
Bed
--
Bath
--
Sq Ft
0.26
Acres
About This Home
This home is located at 4654 N Saint Louis Ave Unit 4654, Chicago, IL 60625 and is currently estimated at $200,780. 4654 N Saint Louis Ave Unit 4654 is a home located in Cook County with nearby schools including Haugan Elementary School, Roosevelt High School, and ASPIRA Haugan Middle School.
Ownership History
Date
Name
Owned For
Owner Type
Purchase Details
Closed on
May 27, 2010
Sold by
Stratworks Delaware Inc
Bought by
Herr Christie
Current Estimated Value
Home Financials for this Owner
Home Financials are based on the most recent Mortgage that was taken out on this home.
Original Mortgage
$100,000
Interest Rate
4.74%
Mortgage Type
New Conventional
Purchase Details
Closed on
Oct 23, 2009
Sold by
Lasalle Bank Na
Bought by
Stratworks Delaware Inc
Purchase Details
Closed on
Jul 10, 2008
Sold by
Mathews
Bought by
Lasalle Bank Na and Merrill Lynch Mortgage Investors Inc 200
Purchase Details
Closed on
Apr 19, 2006
Sold by
4648 N St Louis Llc
Bought by
Mathews Susamma and Mathews Bhuttu
Home Financials for this Owner
Home Financials are based on the most recent Mortgage that was taken out on this home.
Original Mortgage
$139,200
Interest Rate
9.39%
Mortgage Type
Fannie Mae Freddie Mac
Create a Home Valuation Report for This Property
The Home Valuation Report is an in-depth analysis detailing your home's value as well as a comparison with similar homes in the area
Home Values in the Area
Average Home Value in this Area
Purchase History
| Date | Buyer | Sale Price | Title Company |
|---|---|---|---|
| Herr Christie | $120,000 | First American | |
| Stratworks Delaware Inc | $59,500 | Premier Title | |
| Lasalle Bank Na | -- | None Available | |
| Mathews Susamma | $174,000 | Multiple |
Source: Public Records
Mortgage History
| Date | Status | Borrower | Loan Amount |
|---|---|---|---|
| Previous Owner | Herr Christie | $100,000 | |
| Previous Owner | Mathews Susamma | $139,200 |
Source: Public Records
Tax History Compared to Growth
Tax History
| Year | Tax Paid | Tax Assessment Tax Assessment Total Assessment is a certain percentage of the fair market value that is determined by local assessors to be the total taxable value of land and additions on the property. | Land | Improvement |
|---|---|---|---|---|
| 2024 | $2,347 | $16,149 | $1,774 | $14,375 |
| 2023 | $2,266 | $14,400 | $1,419 | $12,981 |
| 2022 | $2,266 | $14,400 | $1,419 | $12,981 |
| 2021 | $2,233 | $14,399 | $1,419 | $12,980 |
| 2020 | $2,172 | $12,820 | $734 | $12,086 |
| 2019 | $2,205 | $14,367 | $734 | $13,633 |
| 2018 | $2,166 | $14,367 | $734 | $13,633 |
| 2017 | $950 | $7,776 | $658 | $7,118 |
| 2016 | $1,061 | $7,776 | $658 | $7,118 |
| 2015 | $948 | $7,776 | $658 | $7,118 |
| 2014 | $1,531 | $10,791 | $608 | $10,183 |
| 2013 | $1,490 | $10,791 | $608 | $10,183 |
Source: Public Records
Map
Nearby Homes
- 4534 N Saint Louis Ave
- 4734 N Drake Ave
- 4621 N Monticello Ave
- 4619 N Lawndale Ave Unit 1
- 4714 N Spaulding Ave
- 4426 N Drake Ave
- 3711 W Lawrence Ave
- 3550 W Montrose Ave Unit 107
- 4906 N Drake Ave Unit 3
- 4438 N Spaulding Ave
- 3618 W Ainslie St Unit 3W
- 4903 N Monticello Ave Unit 3
- 3733 W Sunnyside Ave
- 4515 N Hamlin Ave
- 4900 N Lawndale Ave Unit G
- 4322 N Kimball Ave
- 4948 N Kimball Ave Unit 4W
- 4837 N Sawyer Ave
- 4438 N Kedzie Ave Unit G-1
- 3135 W Leland Ave Unit 3W
- 4654 N Saint Louis Ave Unit 2G
- 4654 N Saint Louis Ave Unit 4654
- 4654 N Saint Louis Ave Unit 4654
- 4654 N Saint Louis Ave Unit 4654
- 4654 N Saint Louis Ave Unit 4654
- 4654 N Saint Louis Ave Unit 4654
- 4654 N Saint Louis Ave Unit 1G
- 4654 N St Louis Ave Unit 1G
- 4654 N Saint Louis Ave Unit 3F
- 4654 N Saint Louis Ave Unit 3G
- 4654 N Saint Louis Ave Unit 2F
- 4654 N Saint Louis Ave Unit 1F
- 4654 N St Louis Ave Unit 2F
- 4654 N St Louis Ave Unit 2G
- 3503 W Leland Ave Unit GDN
- 3503 W Leland Ave Unit 2W
- 3503 W Leland Ave Unit 3W
- 3503 W Leland Ave Unit 2E
- 3503 W Leland Ave Unit 1E
- 3503 W Leland Ave Unit 1