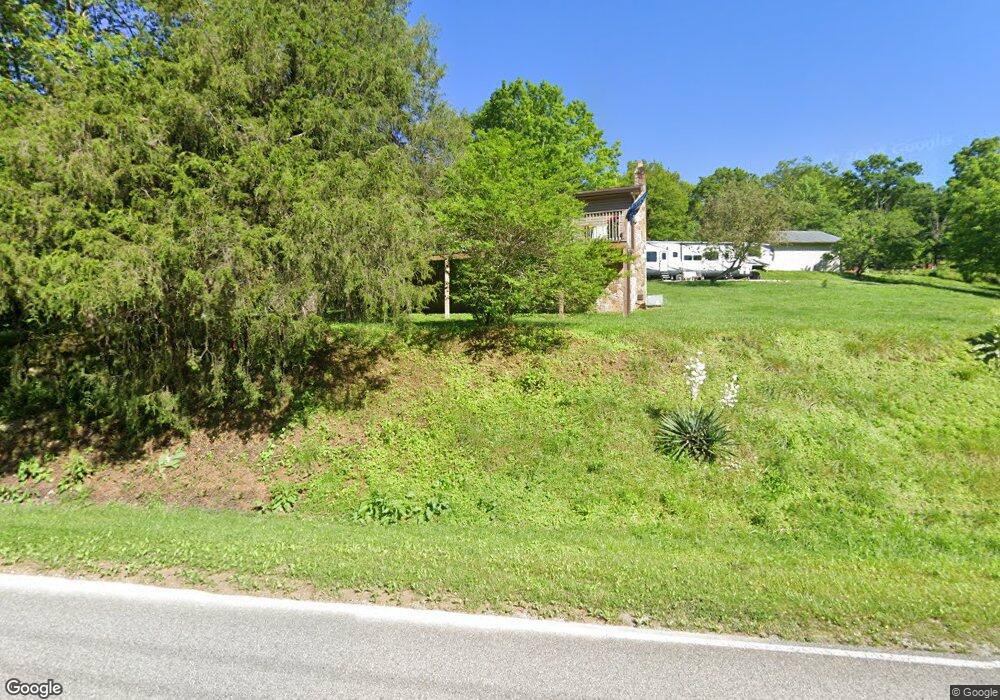
4654 Stinking Creek Rd Pioneer, TN 37847
Estimated Value: $148,526 - $274,000
--
Bed
1
Bath
1,104
Sq Ft
$204/Sq Ft
Est. Value
About This Home
This home is located at 4654 Stinking Creek Rd, Pioneer, TN 37847 and is currently estimated at $224,882, approximately $203 per square foot. 4654 Stinking Creek Rd is a home located in Campbell County.
Ownership History
Date
Name
Owned For
Owner Type
Purchase Details
Closed on
Aug 30, 2024
Sold by
Hileman Angele and Hileman Angele Blyzaite
Bought by
Hileman Randall Dean and Hileman Randall D
Current Estimated Value
Home Financials for this Owner
Home Financials are based on the most recent Mortgage that was taken out on this home.
Original Mortgage
$178,000
Interest Rate
6.2%
Mortgage Type
Credit Line Revolving
Purchase Details
Closed on
Jan 31, 2020
Sold by
Wilson Judy A
Bought by
Hileman Randall D and Hileman Angele
Home Financials for this Owner
Home Financials are based on the most recent Mortgage that was taken out on this home.
Original Mortgage
$108,000
Interest Rate
3.6%
Mortgage Type
New Conventional
Purchase Details
Closed on
May 29, 1990
Bought by
Wilson Franklin E and Wilson Judy
Purchase Details
Closed on
Jan 24, 1983
Bought by
Rutherford Dora Pearl Life Estate
Purchase Details
Closed on
Jan 2, 1966
Create a Home Valuation Report for This Property
The Home Valuation Report is an in-depth analysis detailing your home's value as well as a comparison with similar homes in the area
Home Values in the Area
Average Home Value in this Area
Purchase History
| Date | Buyer | Sale Price | Title Company |
|---|---|---|---|
| Hileman Randall Dean | -- | None Listed On Document | |
| Hileman Randall Dean | -- | None Listed On Document | |
| Hileman Randall D | $152,000 | None Available | |
| Wilson Franklin E | $5,000 | -- | |
| Rutherford Dora Pearl Life Estate | -- | -- | |
| -- | -- | -- |
Source: Public Records
Mortgage History
| Date | Status | Borrower | Loan Amount |
|---|---|---|---|
| Previous Owner | Hileman Randall Dean | $178,000 | |
| Previous Owner | Hileman Randall D | $108,000 |
Source: Public Records
Tax History Compared to Growth
Tax History
| Year | Tax Paid | Tax Assessment Tax Assessment Total Assessment is a certain percentage of the fair market value that is determined by local assessors to be the total taxable value of land and additions on the property. | Land | Improvement |
|---|---|---|---|---|
| 2024 | $378 | $31,125 | $10,200 | $20,925 |
| 2023 | $432 | $20,900 | $7,100 | $13,800 |
| 2022 | $432 | $20,900 | $7,100 | $13,800 |
| 2021 | $432 | $20,900 | $7,100 | $13,800 |
| 2020 | $423 | $20,900 | $7,100 | $13,800 |
| 2019 | $432 | $20,900 | $7,100 | $13,800 |
| 2018 | $382 | $16,975 | $5,550 | $11,425 |
| 2017 | $382 | $16,975 | $5,550 | $11,425 |
| 2016 | $382 | $16,975 | $5,550 | $11,425 |
| 2015 | $338 | $16,975 | $5,550 | $11,425 |
| 2014 | $338 | $16,975 | $5,550 | $11,425 |
| 2013 | -- | $16,975 | $5,550 | $11,425 |
Source: Public Records
Map
Nearby Homes
- 150 Timber Oaks Ln
- 0 Stinking Creek Rd
- 3329 Stinking Creek Rd
- 976 Lone Rd
- 142 Wagon Wheel Ln
- 0 Lone Rd
- 143 Elk Ridge Ln
- 137 Summerset Ln
- 2506 Little Elk Creek Rd
- 130 Lowwood Ln
- 580 Elk Fork Rd
- 3866 Highway 297
- 0 Melvin Hollow Rd Unit LotWP001 23933593
- 0 Melvin Hollow Rd Unit LotWP003 23933595
- 0 Melvin Hollow Rd Unit 1305423
- 0 Melvin Hollow Rd Unit 1305420
- 0 Melvin Hollow Rd Unit 1271460
- 739 Rock Creek Ln
- 256 Ensley Ln
- 0 Hatfield Creek Rd
- 4645 Stinking Creek Rd
- 4732 Stinking Creek Rd
- 4738 Stinking Creek Rd
- 4757 Stinking Creek Rd
- 4791 Stinking Creek Rd
- 4791 Stinking Creek Rd
- 192 Adam Hollow Ln
- 4476 Stinking Creek Rd
- 126 Adams Ln
- 206 Adam Hollow Ln
- 4833 Stinking Creek Rd
- 4912 Stinking Creek Rd
- 336 Adam Hollow Ln
- 314 Lonesome Mountain Ln
- 118 Adam Hollow Ln
- 4199 Stinking Creek Rd
- 425 Lonesome Mountain Ln
- 0 Lonesome Mountain Ln Unit 1250185
- 0 Lonesome Mountain Ln Unit 1250184
- 0 Lonesome Mountain Ln Unit 1250181