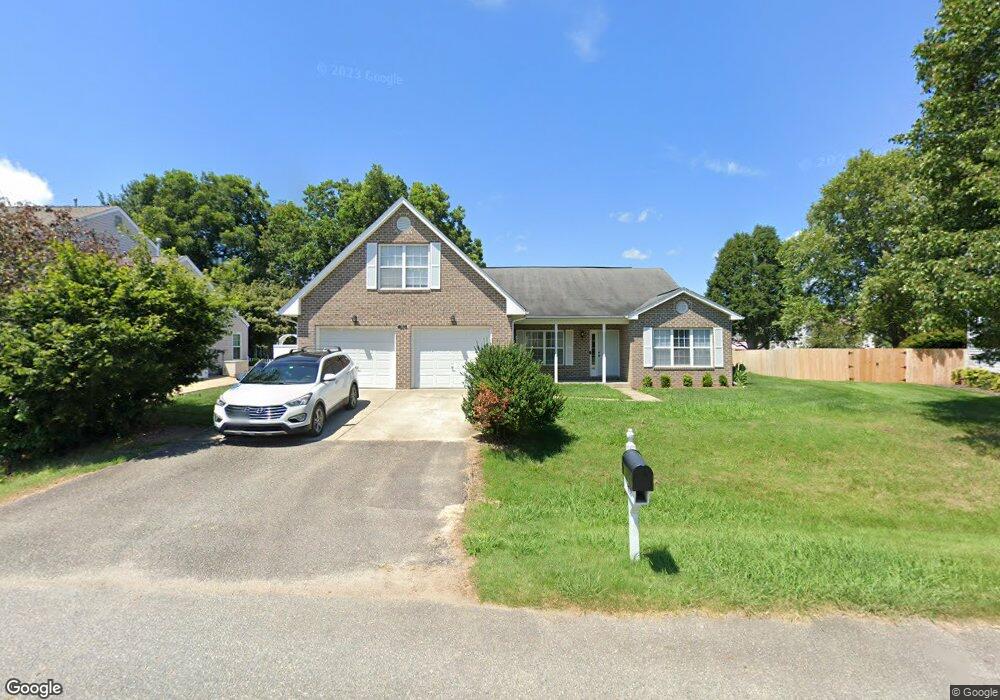
4655 Sir Gilbert Loop Williamsburg, VA 23185
Jamestown NeighborhoodEstimated Value: $493,000 - $531,000
3
Beds
3
Baths
2,717
Sq Ft
$190/Sq Ft
Est. Value
About This Home
This home is located at 4655 Sir Gilbert Loop, Williamsburg, VA 23185 and is currently estimated at $516,297, approximately $190 per square foot. 4655 Sir Gilbert Loop is a home located in James City County with nearby schools including Clara Byrd Baker Elementary School, Berkeley Middle School, and Jamestown High School.
Ownership History
Date
Name
Owned For
Owner Type
Purchase Details
Closed on
Oct 29, 2020
Sold by
Citibank Na
Bought by
Redfern Amanda
Current Estimated Value
Home Financials for this Owner
Home Financials are based on the most recent Mortgage that was taken out on this home.
Original Mortgage
$293,265
Outstanding Balance
$260,844
Interest Rate
2.9%
Mortgage Type
New Conventional
Estimated Equity
$255,453
Purchase Details
Closed on
Nov 7, 2019
Sold by
Surety Trustees Llc
Bought by
Citibank Na and American Home Mortgage Assets Trust
Purchase Details
Closed on
Mar 18, 2002
Sold by
Virginia Enterprises Inc
Bought by
Lyles Johnathan Lee
Home Financials for this Owner
Home Financials are based on the most recent Mortgage that was taken out on this home.
Original Mortgage
$209,090
Interest Rate
7.01%
Mortgage Type
VA
Create a Home Valuation Report for This Property
The Home Valuation Report is an in-depth analysis detailing your home's value as well as a comparison with similar homes in the area
Home Values in the Area
Average Home Value in this Area
Purchase History
| Date | Buyer | Sale Price | Title Company |
|---|---|---|---|
| Redfern Amanda | $308,700 | None Available | |
| Citibank Na | $305,930 | None Available | |
| Lyles Johnathan Lee | $203,000 | -- |
Source: Public Records
Mortgage History
| Date | Status | Borrower | Loan Amount |
|---|---|---|---|
| Open | Redfern Amanda | $293,265 | |
| Previous Owner | Lyles Johnathan Lee | $209,090 |
Source: Public Records
Tax History Compared to Growth
Tax History
| Year | Tax Paid | Tax Assessment Tax Assessment Total Assessment is a certain percentage of the fair market value that is determined by local assessors to be the total taxable value of land and additions on the property. | Land | Improvement |
|---|---|---|---|---|
| 2025 | $3,596 | $461,000 | $110,800 | $350,200 |
| 2024 | $3,596 | $461,000 | $110,800 | $350,200 |
| 2023 | $3,596 | $374,900 | $80,000 | $294,900 |
| 2022 | $3,112 | $374,900 | $80,000 | $294,900 |
| 2021 | $2,853 | $339,700 | $71,300 | $268,400 |
| 2020 | $2,853 | $339,700 | $71,300 | $268,400 |
| 2019 | $2,730 | $325,000 | $68,500 | $256,500 |
| 2018 | $2,730 | $325,000 | $68,500 | $256,500 |
| 2017 | $2,664 | $317,100 | $66,500 | $250,600 |
| 2016 | $2,664 | $317,100 | $66,500 | $250,600 |
| 2015 | $1,260 | $300,100 | $49,500 | $250,600 |
| 2014 | $1,155 | $300,100 | $49,500 | $250,600 |
Source: Public Records
Map
Nearby Homes
- 2709 Smallpage Trace
- 4608 Prince Trevor Dr
- 2704 Smallpage Trace
- 4715 Yeardley Loop
- 117 Rothbury Dr
- 1404 London Company Way
- 2504 William Tankard Dr
- 258 Sandy Bay Rd
- 110 Arena St
- 3268 Reades Way
- 4427 Landfall Dr
- 402 Prosperity Ct
- 304 Prosperity Ct
- 2906 Robert Hunt N
- 4396 Landfall Dr
- 127 Constance Ave
- 1001 Prosperity Ct
- 3113 Ironbound Rd
- 97 Holly Grove
- 88 Holly Grove
- 4651 Sir Gilbert Loop
- 4659 Sir Gilbert Loop
- 4608 Yeardley Loop
- 4612 Yeardley Loop
- 4604 Yeardley Loop
- 4647 Sir Gilbert Loop
- 4663 Sir Gilbert Loop
- 4660 Sir Gilbert Loop
- 4652 Sir Gilbert Loop
- 4616 Yeardley Loop
- 2696 Sir Thomas Way
- 4667 Sir Gilbert Loop
- 4620 Yeardley Loop
- 4668 Sir Gilbert Loop
- 2692 Sir Thomas Way
- 4643 Sir Gilbert Loop
- 4671 Sir Gilbert Loop
- 4609 Yeardley Loop
- 4644 Yeardley Loop
- 4756 Yeardley Loop