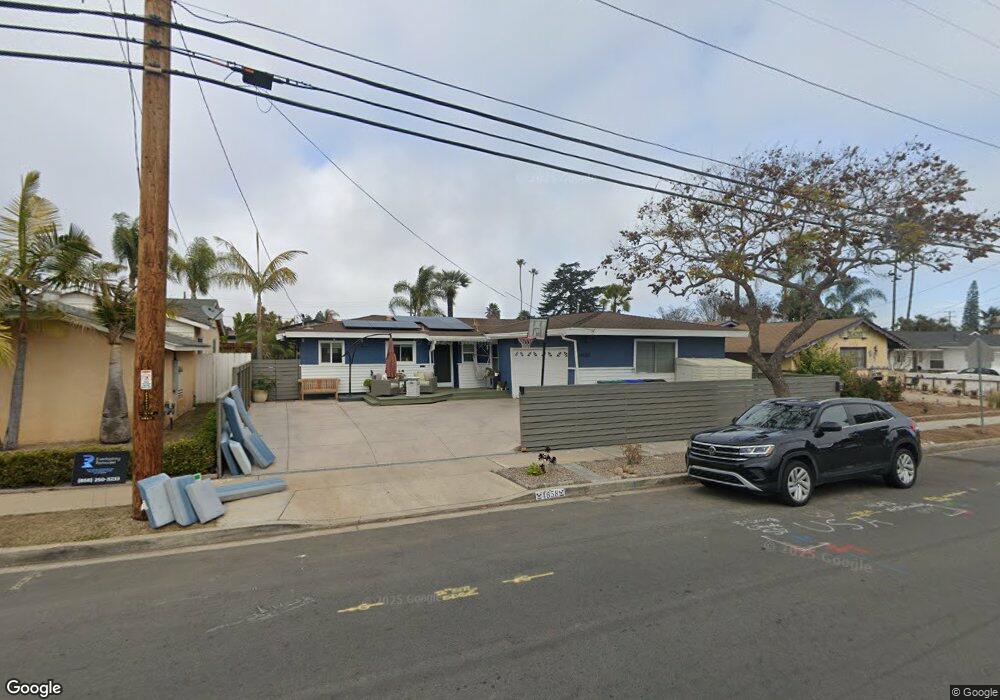
4658 Mount Etna Dr San Diego, CA 92117
Clairemont Mesa West NeighborhoodEstimated Value: $1,089,908 - $1,131,000
3
Beds
2
Baths
1,188
Sq Ft
$933/Sq Ft
Est. Value
About This Home
This home is located at 4658 Mount Etna Dr, San Diego, CA 92117 and is currently estimated at $1,108,227, approximately $932 per square foot. 4658 Mount Etna Dr is a home located in San Diego County with nearby schools including Holmes Elementary, Marston Middle School, and Clairemont High School.
Ownership History
Date
Name
Owned For
Owner Type
Purchase Details
Closed on
Jul 12, 2021
Sold by
Mccabe Daniel Joseph and Mccabe Jessica Rufo
Bought by
Mccabe Daniel Joseph and Mccabe Jessica Rufo
Current Estimated Value
Home Financials for this Owner
Home Financials are based on the most recent Mortgage that was taken out on this home.
Original Mortgage
$463,000
Outstanding Balance
$353,858
Interest Rate
2.9%
Mortgage Type
New Conventional
Estimated Equity
$754,369
Purchase Details
Closed on
Oct 16, 2019
Sold by
Mccabe Daniel J and Mccabe Jessica A
Bought by
Mccabe Daniel Joseph and Mccabe Jessica Rufo
Purchase Details
Closed on
Feb 20, 2010
Sold by
Mccabe Daniel J and Mccabe Jessica A
Bought by
Mccabe Daniel J and Mccabe Jessica A
Home Financials for this Owner
Home Financials are based on the most recent Mortgage that was taken out on this home.
Original Mortgage
$372,800
Interest Rate
5.03%
Mortgage Type
New Conventional
Purchase Details
Closed on
Jun 25, 2007
Sold by
Pearce Dianna A
Bought by
Mccabe Daniel J and Rufo Jessica
Home Financials for this Owner
Home Financials are based on the most recent Mortgage that was taken out on this home.
Original Mortgage
$93,600
Interest Rate
6.32%
Mortgage Type
Stand Alone Second
Purchase Details
Closed on
Feb 16, 2006
Sold by
Smith Clara I
Bought by
Smith Clara I and Revocable Intervivos Tr Of Clara I Smith
Home Financials for this Owner
Home Financials are based on the most recent Mortgage that was taken out on this home.
Original Mortgage
$544,185
Interest Rate
6.17%
Mortgage Type
Trade
Purchase Details
Closed on
Feb 15, 2006
Sold by
Smith Clara I
Bought by
Smith Clara I
Home Financials for this Owner
Home Financials are based on the most recent Mortgage that was taken out on this home.
Original Mortgage
$544,185
Interest Rate
6.17%
Mortgage Type
Trade
Purchase Details
Closed on
Sep 18, 2002
Sold by
Smith Clara I
Bought by
Smith Clara I
Home Financials for this Owner
Home Financials are based on the most recent Mortgage that was taken out on this home.
Original Mortgage
$60,500
Interest Rate
5.56%
Mortgage Type
Purchase Money Mortgage
Purchase Details
Closed on
Sep 13, 2002
Sold by
Smith Clara I
Bought by
Smith Clara I
Home Financials for this Owner
Home Financials are based on the most recent Mortgage that was taken out on this home.
Original Mortgage
$60,500
Interest Rate
5.56%
Mortgage Type
Purchase Money Mortgage
Purchase Details
Closed on
Mar 7, 1995
Sold by
Smith Clara I
Bought by
Smith Clara I
Create a Home Valuation Report for This Property
The Home Valuation Report is an in-depth analysis detailing your home's value as well as a comparison with similar homes in the area
Home Values in the Area
Average Home Value in this Area
Purchase History
| Date | Buyer | Sale Price | Title Company |
|---|---|---|---|
| Mccabe Daniel Joseph | -- | North American Title Co Inc | |
| Mccabe Daniel Joseph | -- | North American Title Co Inc | |
| Mccabe Daniel Joseph | -- | None Available | |
| Mccabe Daniel J | -- | Lsi Local Solutions | |
| Mccabe Daniel J | $468,000 | Chicago Title Co | |
| Smith Clara I | -- | Accommodation | |
| Smith Clara I | -- | First American Title | |
| Smith Clara I | -- | California Title Company | |
| Smith Clara I | -- | American West Title Inc | |
| Smith Clara I | -- | -- | |
| Smith Clara I | -- | -- |
Source: Public Records
Mortgage History
| Date | Status | Borrower | Loan Amount |
|---|---|---|---|
| Open | Mccabe Daniel Joseph | $463,000 | |
| Closed | Mccabe Daniel J | $372,800 | |
| Closed | Mccabe Daniel J | $93,600 | |
| Closed | Mccabe Daniel J | $374,400 | |
| Previous Owner | Smith Clara I | $544,185 | |
| Previous Owner | Smith Clara I | $544,185 | |
| Previous Owner | Smith Clara I | $60,500 |
Source: Public Records
Tax History Compared to Growth
Tax History
| Year | Tax Paid | Tax Assessment Tax Assessment Total Assessment is a certain percentage of the fair market value that is determined by local assessors to be the total taxable value of land and additions on the property. | Land | Improvement |
|---|---|---|---|---|
| 2025 | $7,350 | $614,698 | $499,117 | $115,581 |
| 2024 | $7,350 | $602,646 | $489,331 | $113,315 |
| 2023 | $7,186 | $590,831 | $479,737 | $111,094 |
| 2022 | $6,993 | $579,247 | $470,331 | $108,916 |
| 2021 | $6,944 | $567,890 | $461,109 | $106,781 |
| 2020 | $6,859 | $562,068 | $456,381 | $105,687 |
| 2019 | $6,735 | $551,048 | $447,433 | $103,615 |
| 2018 | $6,296 | $540,244 | $438,660 | $101,584 |
| 2017 | $5,798 | $500,000 | $406,000 | $94,000 |
| 2016 | $5,232 | $450,000 | $366,000 | $84,000 |
| 2015 | $4,998 | $430,000 | $350,000 | $80,000 |
| 2014 | $4,428 | $380,000 | $310,000 | $70,000 |
Source: Public Records
Map
Nearby Homes
- 4772 Mount Gaywas Dr
- 4472 Mount Lindsey Ave
- 4915 Mount Gaywas Dr
- 4527 Chinook Ct
- 4666 Shoshoni Ave
- 4226 Mount Voss Dr
- 4380 Rolfe Rd
- 4667 Chateau Place
- 4781 Boise Ave
- 4587 Rolfe Rd
- 4203 Tolowa St
- 4774 Chickasaw Ct
- 5061 Canosa Ave
- 4813 Boise Ave
- 4182 Seri St
- 4716 Mount Cervin Dr
- 4501 Bannock Ave
- 4509 Manitou Way
- 4951 57 Genesee Ave
- 5252 Balboa Arms Dr Unit 180
- 4670 Mount Etna Dr
- 4644 Mount Etna Dr
- 4681 Mount Frissell Dr
- 4689 Mount Frissell Dr
- 4684 Mount Etna Dr
- 4630 Mount Etna Dr
- 4671 Mount Frissell Dr
- 4697 Mount Frissell Dr
- 4702 Mount Etna Dr
- 4618 Mount Etna Dr
- 4701 Mount Frissell Dr
- 4661 Mount Frissell Dr
- 4714 Mount Etna Dr
- 4715 Mount Frissell Dr
- 4678 Mount Frissell Dr
- 4455 Mount Herbert Ave
- 4465 Mount Herbert Ave
- 4475 Mount Herbert Ave
- 4690 Mount Frissell Dr
- 4485 Mount Herbert Ave