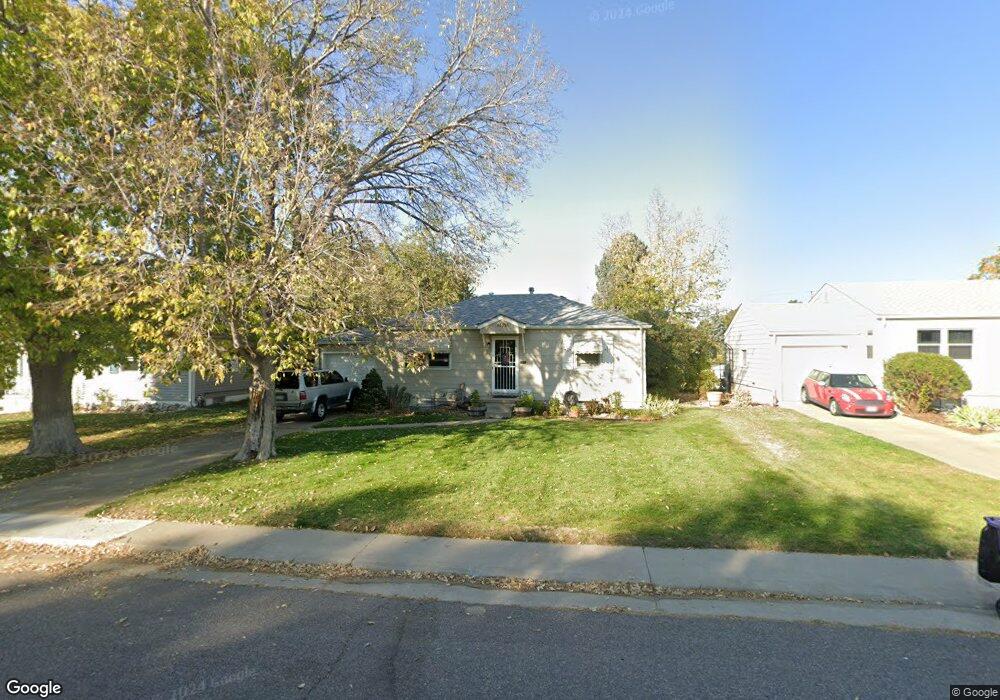
4659 E Amherst Ave Denver, CO 80222
University Hills NeighborhoodEstimated Value: $480,754 - $538,000
2
Beds
2
Baths
816
Sq Ft
$626/Sq Ft
Est. Value
About This Home
This home is located at 4659 E Amherst Ave, Denver, CO 80222 and is currently estimated at $511,189, approximately $626 per square foot. 4659 E Amherst Ave is a home located in Denver County with nearby schools including Bradley Elementary School, Hamilton Middle School, and Thomas Jefferson High School.
Ownership History
Date
Name
Owned For
Owner Type
Purchase Details
Closed on
Jul 28, 2005
Sold by
Clark Bonnie J
Bought by
Clark Bonnie J and Corbett Kathleen L
Current Estimated Value
Home Financials for this Owner
Home Financials are based on the most recent Mortgage that was taken out on this home.
Original Mortgage
$180,000
Outstanding Balance
$91,254
Interest Rate
5.51%
Mortgage Type
Fannie Mae Freddie Mac
Estimated Equity
$419,935
Purchase Details
Closed on
Nov 30, 2001
Sold by
Benson Charles T
Bought by
Hawker Diane and Hawker Holly
Home Financials for this Owner
Home Financials are based on the most recent Mortgage that was taken out on this home.
Original Mortgage
$203,801
Interest Rate
6.57%
Mortgage Type
FHA
Create a Home Valuation Report for This Property
The Home Valuation Report is an in-depth analysis detailing your home's value as well as a comparison with similar homes in the area
Home Values in the Area
Average Home Value in this Area
Purchase History
| Date | Buyer | Sale Price | Title Company |
|---|---|---|---|
| Clark Bonnie J | -- | Land Title Guarantee Company | |
| Clark Bonnie J | $225,000 | Land Title Guarantee Company | |
| Hawker Diane | $207,000 | -- |
Source: Public Records
Mortgage History
| Date | Status | Borrower | Loan Amount |
|---|---|---|---|
| Open | Clark Bonnie J | $180,000 | |
| Previous Owner | Hawker Diane | $203,801 |
Source: Public Records
Tax History
| Year | Tax Paid | Tax Assessment Tax Assessment Total Assessment is a certain percentage of the fair market value that is determined by local assessors to be the total taxable value of land and additions on the property. | Land | Improvement |
|---|---|---|---|---|
| 2025 | $2,590 | $39,490 | $31,470 | $31,470 |
| 2024 | $2,590 | $32,700 | $21,620 | $11,080 |
| 2023 | $2,534 | $32,700 | $21,620 | $11,080 |
| 2022 | $2,177 | $27,370 | $20,280 | $7,090 |
| 2021 | $2,101 | $28,150 | $20,860 | $7,290 |
| 2020 | $1,980 | $26,690 | $19,640 | $7,050 |
| 2019 | $1,925 | $26,690 | $19,640 | $7,050 |
| 2018 | $1,776 | $22,960 | $17,310 | $5,650 |
| 2017 | $1,771 | $22,960 | $17,310 | $5,650 |
| 2016 | $1,801 | $22,090 | $16,398 | $5,692 |
| 2015 | $1,726 | $22,090 | $16,398 | $5,692 |
| 2014 | $1,433 | $17,250 | $8,199 | $9,051 |
Source: Public Records
Map
Nearby Homes
- 2645 S Cherry St Unit 2675
- 4585 E Yale Ave Unit 4587
- 4570 E Yale Ave Unit 706
- 4570 E Yale Ave Unit 503
- 4570 E Yale Ave Unit 1104
- 4570 E Yale Ave Unit 1004
- 2851 S Dexter Way
- 2590 S Birch St
- 2981 S Dahlia St
- 2510 S Cherry St
- 2575 S Birch St
- 4827 E Vassar Ave
- 2901 S Bellaire St
- 3013 S Cherry Way
- 2935 S Fairfax St
- 4301 E La Salle Place
- 4391 E Harvard Ave
- 2749 S Glencoe St
- 4251 E Harvard Ave
- 3031 S Birch St
- 4649 E Amherst Ave
- 4673 E Amherst Ave
- 4631 E Amherst Ave
- 4687 E Amherst Ave
- 4668 E Yale Ave
- 4650 E Yale Ave
- 4650 R E Yale Ave
- 4650 E Amherst Ave
- 2801 S Dexter Way
- 4684 E Yale Ave
- 4640 E Amherst Ave
- 4695 E Amherst Ave
- 4617 E Amherst Ave
- 4632 E Yale Ave
- 4630 E Amherst Ave
- 4710 E Yale Ave
- 2815 S Dexter Way
- 4701 E Amherst Ave
- 4620 E Amherst Ave
- 2800 S Dexter Way
Your Personal Tour Guide
Ask me questions while you tour the home.