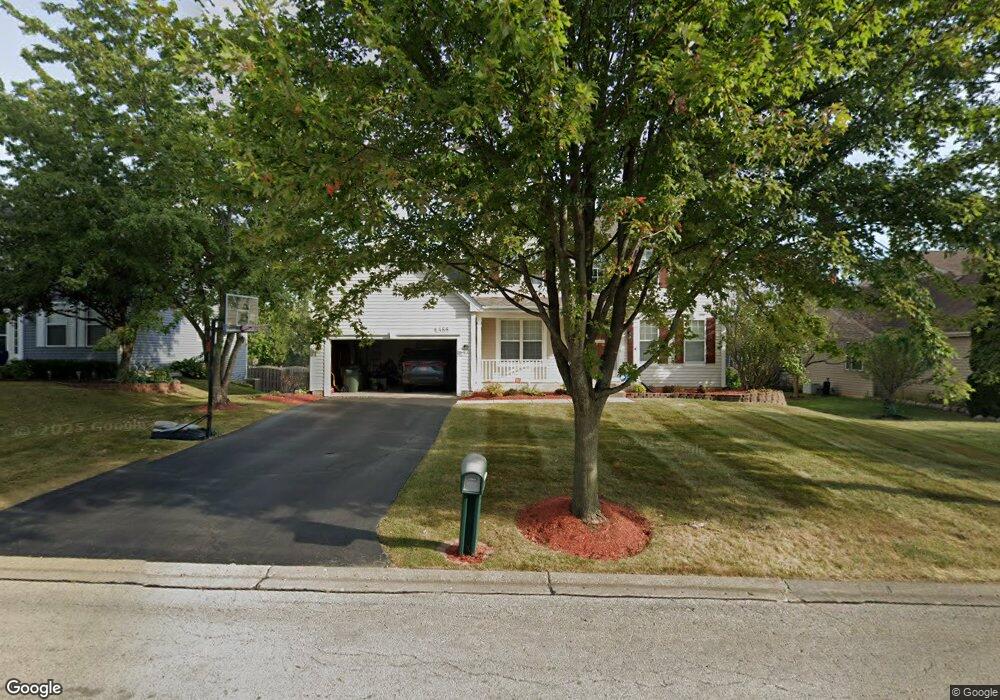
466 Mockingbird Ct Lindenhurst, IL 60046
Estimated Value: $432,521 - $453,000
4
Beds
3
Baths
2,342
Sq Ft
$190/Sq Ft
Est. Value
About This Home
This home is located at 466 Mockingbird Ct, Lindenhurst, IL 60046 and is currently estimated at $445,630, approximately $190 per square foot. 466 Mockingbird Ct is a home located in Lake County with nearby schools including Millburn Elementary School, Millburn Middle School, and Grayslake North High School.
Ownership History
Date
Name
Owned For
Owner Type
Purchase Details
Closed on
Mar 23, 2005
Sold by
Weichert Relocation Resources Inc
Bought by
Rogalski David T and Dorgan Kelly A
Current Estimated Value
Home Financials for this Owner
Home Financials are based on the most recent Mortgage that was taken out on this home.
Original Mortgage
$258,000
Interest Rate
5.87%
Mortgage Type
Fannie Mae Freddie Mac
Purchase Details
Closed on
Mar 1, 2005
Sold by
Liu Qingping and Han Zhiying
Bought by
Weichert Relocation Resources Inc
Home Financials for this Owner
Home Financials are based on the most recent Mortgage that was taken out on this home.
Original Mortgage
$258,000
Interest Rate
5.87%
Mortgage Type
Fannie Mae Freddie Mac
Purchase Details
Closed on
Apr 19, 2000
Sold by
Westfield Development Corp
Bought by
Liu Oingping and Han Zhiying
Home Financials for this Owner
Home Financials are based on the most recent Mortgage that was taken out on this home.
Original Mortgage
$220,000
Interest Rate
7.62%
Create a Home Valuation Report for This Property
The Home Valuation Report is an in-depth analysis detailing your home's value as well as a comparison with similar homes in the area
Home Values in the Area
Average Home Value in this Area
Purchase History
| Date | Buyer | Sale Price | Title Company |
|---|---|---|---|
| Rogalski David T | $322,500 | Attorneys Title Guaranty Fun | |
| Weichert Relocation Resources Inc | $322,500 | Attorneys Title Guaranty Fun | |
| Liu Oingping | $245,000 | First American Title |
Source: Public Records
Mortgage History
| Date | Status | Borrower | Loan Amount |
|---|---|---|---|
| Previous Owner | Rogalski David T | $258,000 | |
| Previous Owner | Liu Oingping | $220,000 |
Source: Public Records
Tax History Compared to Growth
Tax History
| Year | Tax Paid | Tax Assessment Tax Assessment Total Assessment is a certain percentage of the fair market value that is determined by local assessors to be the total taxable value of land and additions on the property. | Land | Improvement |
|---|---|---|---|---|
| 2024 | $11,223 | $122,022 | $14,685 | $107,337 |
| 2023 | $12,528 | $107,812 | $12,975 | $94,837 |
| 2022 | $12,528 | $95,621 | $14,409 | $81,212 |
| 2021 | $12,223 | $88,826 | $13,385 | $75,441 |
| 2020 | $12,233 | $85,980 | $12,956 | $73,024 |
| 2019 | $11,693 | $82,634 | $12,452 | $70,182 |
| 2018 | $11,094 | $79,733 | $17,552 | $62,181 |
| 2017 | $10,617 | $77,607 | $17,084 | $60,523 |
| 2016 | $11,504 | $80,069 | $17,626 | $62,443 |
| 2015 | $12,443 | $83,090 | $18,291 | $64,799 |
| 2014 | $11,926 | $84,690 | $14,112 | $70,578 |
| 2012 | $10,593 | $85,098 | $14,180 | $70,918 |
Source: Public Records
Map
Nearby Homes
- 2424 E Thornwood Dr
- 2792 Spring Cir S
- 710 Greenbriar Ln
- 2798 Spring Cir S
- 200 S Beck Rd Unit 12
- 2813 Spring Cir S
- 37430 N Us Highway 45
- 2200 Neubauer Cir Unit 131
- 2893 Briargate Dr
- 1505 Neubauer Cir
- 3707 Neubauer Cir
- 40 U S 45
- 77 Bridlepath Dr
- 37146 N Sistina Ave
- 1200 Neubauer Cir Unit 1306
- 4103 Neubauer Cir Unit 402
- 709 Neubauer Cir
- 2002 Burr Oak Ln
- 62 Ridge Ct
- 19414 W Grand Ave
- 468 Mockingbird Ct
- 464 Mockingbird Ct
- 420 Gold Finch Cir
- 418 Gold Finch Cir
- 422 Gold Finch Cir
- 470 Mockingbird Ct
- 467 Mockingbird Ct
- 416 Gold Finch Cir
- 469 Mockingbird Ct
- 465 Mockingbird Ct
- 452 Mockingbird Ct
- 446 Mockingbird Ct
- 472 Mockingbird Ct
- 414 Gold Finch Cir
- 471 Mockingbird Ct
- 461 Mockingbird Ct
- 440 Mockingbird Ct
- 421 Gold Finch Cir
- 472 Nuthatch Way
- 427 Gold Finch Cir