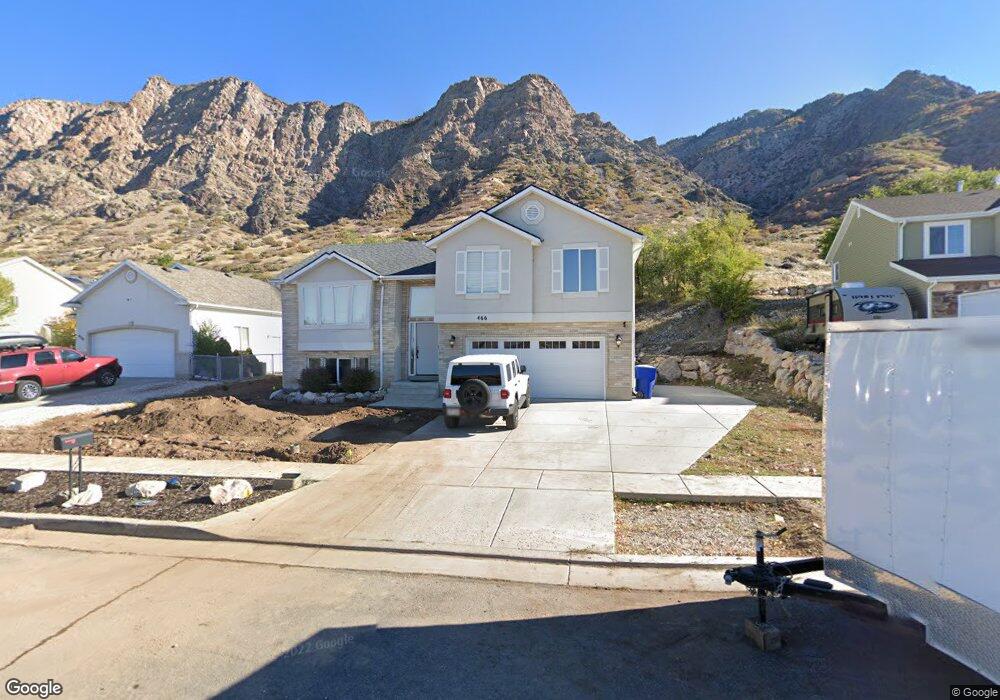
466 Simoron Dr Unit 8 Ogden, UT 84404
Horace Mann NeighborhoodEstimated Value: $421,168 - $431,000
3
Beds
2
Baths
1,285
Sq Ft
$331/Sq Ft
Est. Value
About This Home
This home is located at 466 Simoron Dr Unit 8, Ogden, UT 84404 and is currently estimated at $424,792, approximately $330 per square foot. 466 Simoron Dr Unit 8 is a home located in Weber County with nearby schools including Mound Fort Junior High School and Ben Lomond High School.
Ownership History
Date
Name
Owned For
Owner Type
Purchase Details
Closed on
May 14, 2025
Sold by
Mansfield-Fenners Ragen B and Fenners Joshua R
Bought by
Maser Zachary Edward
Current Estimated Value
Home Financials for this Owner
Home Financials are based on the most recent Mortgage that was taken out on this home.
Original Mortgage
$428,500
Outstanding Balance
$426,980
Interest Rate
6.64%
Mortgage Type
VA
Estimated Equity
-$2,188
Purchase Details
Closed on
Jun 13, 2016
Sold by
Fenners Joshua R
Bought by
Fenners Joshua R and Fenners Ragen B
Home Financials for this Owner
Home Financials are based on the most recent Mortgage that was taken out on this home.
Original Mortgage
$220,029
Interest Rate
3.61%
Mortgage Type
VA
Purchase Details
Closed on
Apr 18, 2013
Sold by
Kania Michael R and Kania Kathie L
Bought by
Fenners Joshua R and Mansfield Fenners Ragen B
Home Financials for this Owner
Home Financials are based on the most recent Mortgage that was taken out on this home.
Original Mortgage
$194,085
Interest Rate
3.51%
Mortgage Type
VA
Purchase Details
Closed on
Mar 5, 2007
Sold by
Kania Michael R and Kania Kathie L
Bought by
Kania Michael R and Kania Kathie L
Home Financials for this Owner
Home Financials are based on the most recent Mortgage that was taken out on this home.
Original Mortgage
$140,000
Interest Rate
5.97%
Mortgage Type
Purchase Money Mortgage
Purchase Details
Closed on
Mar 4, 2005
Sold by
Mcdonald Michael A
Bought by
Barnhill Kathy A
Purchase Details
Closed on
Feb 23, 2004
Sold by
Mcdonald Michael A
Bought by
Mcdonald Michael A
Home Financials for this Owner
Home Financials are based on the most recent Mortgage that was taken out on this home.
Original Mortgage
$147,219
Interest Rate
5.62%
Mortgage Type
FHA
Purchase Details
Closed on
Jul 12, 2002
Sold by
S M Carter Company
Bought by
Mcdonald Michael A
Home Financials for this Owner
Home Financials are based on the most recent Mortgage that was taken out on this home.
Original Mortgage
$145,936
Interest Rate
6.69%
Mortgage Type
FHA
Purchase Details
Closed on
Aug 23, 2001
Sold by
Carter Scott M
Bought by
S M Carter Company
Home Financials for this Owner
Home Financials are based on the most recent Mortgage that was taken out on this home.
Original Mortgage
$121,000
Interest Rate
7.21%
Create a Home Valuation Report for This Property
The Home Valuation Report is an in-depth analysis detailing your home's value as well as a comparison with similar homes in the area
Home Values in the Area
Average Home Value in this Area
Purchase History
| Date | Buyer | Sale Price | Title Company |
|---|---|---|---|
| Maser Zachary Edward | -- | Fidelity National Title | |
| Fenners Joshua R | -- | Hickman Land Title Co | |
| Fenners Joshua R | -- | Hickman Land Title Co | |
| Fenners Joshua R | -- | Inwest Title Services Layton | |
| Kania Michael R | -- | None Available | |
| Kania Michael R | -- | None Available | |
| Barnhill Kathy A | -- | First American Title | |
| Mcdonald Michael A | -- | Guardian Title | |
| Mcdonald Michael A | -- | Security Title | |
| S M Carter Company | -- | Security Title |
Source: Public Records
Mortgage History
| Date | Status | Borrower | Loan Amount |
|---|---|---|---|
| Open | Maser Zachary Edward | $428,500 | |
| Previous Owner | Fenners Joshua R | $220,029 | |
| Previous Owner | Fenners Joshua R | $194,085 | |
| Previous Owner | Kania Michael R | $140,000 | |
| Previous Owner | Mcdonald Michael A | $147,219 | |
| Previous Owner | Mcdonald Michael A | $145,936 | |
| Previous Owner | S M Carter Company | $121,000 |
Source: Public Records
Tax History Compared to Growth
Tax History
| Year | Tax Paid | Tax Assessment Tax Assessment Total Assessment is a certain percentage of the fair market value that is determined by local assessors to be the total taxable value of land and additions on the property. | Land | Improvement |
|---|---|---|---|---|
| 2025 | $112 | $442,159 | $171,279 | $270,880 |
| 2024 | $112 | $433,000 | $171,280 | $261,720 |
| 2023 | $102 | $468,000 | $166,104 | $301,896 |
| 2022 | $1,037 | $256,850 | $69,314 | $187,536 |
| 2021 | $202 | $351,000 | $80,742 | $270,258 |
| 2020 | $90 | $295,000 | $69,765 | $225,235 |
| 2019 | $90 | $266,000 | $59,661 | $206,339 |
| 2018 | $88 | $239,000 | $59,661 | $179,339 |
| 2017 | $2,205 | $226,000 | $53,633 | $172,367 |
| 2016 | $1,960 | $108,165 | $23,921 | $84,244 |
| 2015 | $1,818 | $98,064 | $23,921 | $74,143 |
| 2014 | $1,781 | $94,448 | $23,921 | $70,527 |
Source: Public Records
Map
Nearby Homes
- 462 Hiland Rd
- 3270 N 3325 W Unit 386B
- 446 Robins Ave
- 1568 Hudson St Unit 1
- 724 Hislop Dr
- 1427 Sheridan Dr
- 1363 Lewis Dr
- 777 Simoron Dr
- 1302 Harrop St
- 727 Robins Ave
- 1274 5th St
- 3088 N 3075 W
- 131 Taylor Ave
- 1243 Hudson St
- 1272 Earl Dr
- 261 Van Buren Ave
- 1120 Cross St
- 1115 Cross St
- 223 N Harrison Blvd
- 1410 12th St
- 458 Simoron Dr
- 458 Simoron Dr Unit 9
- 478 Simoron Dr Unit 7
- 478 Simoron Dr
- 444 Simoron Dr
- 444 Simoron Dr Unit 10
- 524 Simoron Dr
- 1529 Alta Vista Cir
- 1529 Alta Vista Cir Unit 12
- 465 Simoron Dr
- 465 Simoron Dr Unit 6
- 509 Simoron Dr
- 432 Simoron Dr
- 432 Simoron Dr Unit 11
- 1535 Alta Vista Cir
- 1535 Alta Vista Cir Unit 13
- 519 Simoron Dr
- 453 Simoron Dr
- 453 Simoron Dr Unit 5
- 534 Simoron Dr