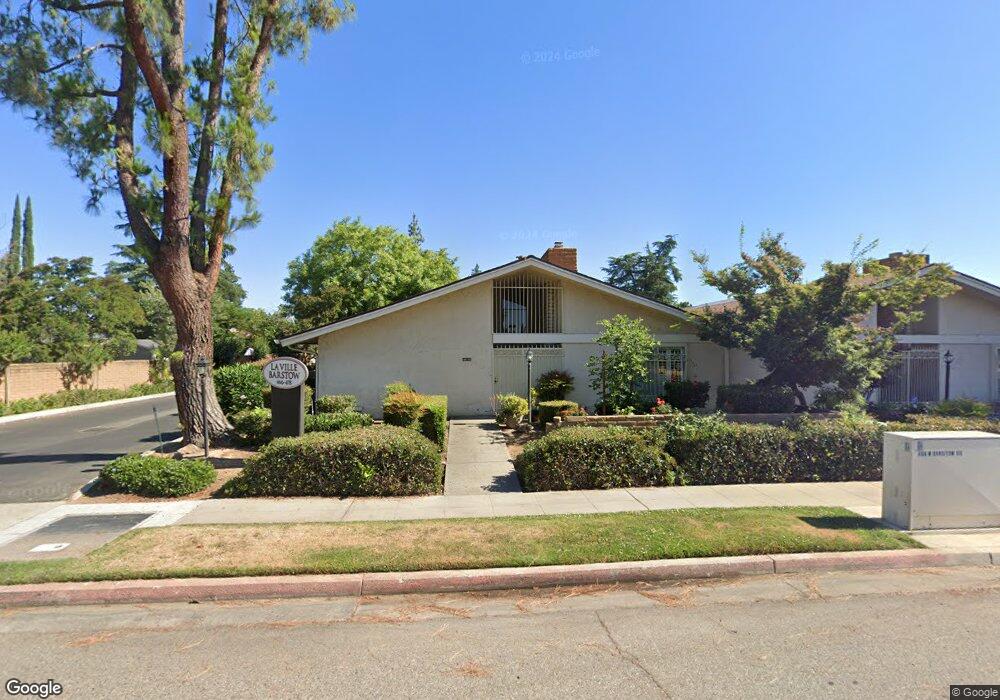
466 W Barstow Ave Fresno, CA 93704
Bullard NeighborhoodEstimated Value: $348,000 - $374,000
2
Beds
2
Baths
1,651
Sq Ft
$217/Sq Ft
Est. Value
About This Home
This home is located at 466 W Barstow Ave, Fresno, CA 93704 and is currently estimated at $358,993, approximately $217 per square foot. 466 W Barstow Ave is a home located in Fresno County with nearby schools including Kratt Elementary School, Tenaya Middle School, and Bullard High School.
Ownership History
Date
Name
Owned For
Owner Type
Purchase Details
Closed on
Mar 12, 2025
Sold by
Romanenko Andrej A
Bought by
Andrej A Romanenko Living Trust and Romanenko
Current Estimated Value
Purchase Details
Closed on
Sep 19, 2023
Sold by
Romanenko Andrej A
Bought by
Romanenko Andrej A and Woolley Marjorie H
Purchase Details
Closed on
Sep 9, 2023
Sold by
Romanenko Andrej A
Bought by
Romanenko Andrej A and Woolley Marjorie H
Purchase Details
Closed on
Nov 23, 2022
Sold by
Kourafas Lauren E
Bought by
Lauren E Kourafas Revocable Living Trust
Purchase Details
Closed on
Jul 19, 2021
Sold by
Kourafas Thomas J
Bought by
Kourafas Thomas J and Kourafas Lauren E
Purchase Details
Closed on
Nov 5, 2003
Sold by
Kourafas Kourafas Patricia M Patricia M and Kourafas James
Bought by
Kourafas Thomas J
Purchase Details
Closed on
Jan 18, 2000
Sold by
Kourafas Patricia M
Bought by
Kourafas Patricia M and James & Patricia M Kourafas Re
Purchase Details
Closed on
Jan 10, 2000
Sold by
Mountanos Stratis
Bought by
Kourafas Patricia M
Create a Home Valuation Report for This Property
The Home Valuation Report is an in-depth analysis detailing your home's value as well as a comparison with similar homes in the area
Home Values in the Area
Average Home Value in this Area
Purchase History
| Date | Buyer | Sale Price | Title Company |
|---|---|---|---|
| Andrej A Romanenko Living Trust | -- | None Listed On Document | |
| Romanenko Andrej A | -- | None Listed On Document | |
| Romanenko Andrej A | -- | None Listed On Document | |
| Lauren E Kourafas Revocable Living Trust | -- | Simplifile | |
| Kourafas Thomas J | -- | None Available | |
| Kourafas Thomas J | -- | -- | |
| Kourafas Patricia M | -- | -- | |
| Kourafas Patricia M | -- | -- |
Source: Public Records
Tax History Compared to Growth
Tax History
| Year | Tax Paid | Tax Assessment Tax Assessment Total Assessment is a certain percentage of the fair market value that is determined by local assessors to be the total taxable value of land and additions on the property. | Land | Improvement |
|---|---|---|---|---|
| 2025 | $4,092 | $336,090 | $83,640 | $252,450 |
| 2023 | $4,092 | $132,128 | $30,220 | $101,908 |
| 2022 | $1,634 | $129,538 | $29,628 | $99,910 |
| 2021 | $1,589 | $126,999 | $29,048 | $97,951 |
| 2020 | $1,583 | $125,698 | $28,751 | $96,947 |
| 2019 | $1,521 | $123,235 | $28,188 | $95,047 |
| 2018 | $1,489 | $120,820 | $27,636 | $93,184 |
| 2017 | $1,463 | $118,452 | $27,095 | $91,357 |
| 2016 | $1,415 | $116,130 | $26,564 | $89,566 |
| 2015 | $1,394 | $114,386 | $26,165 | $88,221 |
| 2014 | $1,366 | $112,146 | $25,653 | $86,493 |
Source: Public Records
Map
Nearby Homes
- 520 W Barstow Ave
- 5370 N Maroa Ave
- 548 W San Jose Ave
- 5549 N Del Mar Ave
- 715 W Browning Ave
- 5180 N Wishon Ave Unit 201
- 5180 N Wishon Ave Unit 103
- 5655 N Poplar Ave
- 5076 N Wishon Ave Unit A
- 5090 N Roosevelt Ave Unit 11
- 5082 N Maroa Ave
- 5672 N Ferger Ave
- 696 W Celeste Ave
- 5048 N Wishon Ave Unit E
- 5075 N College Ave
- 148 W Roberts Ave
- 177 W Bullard Ave
- 1159 W San Madele Ave
- 4915 N Wishon Ct
- 6164 N Maroa Ave
- 466 W Barstow Ave Unit 102
- 466 W Barstow Ave Unit 103
- 466 W Barstow Ave
- 468 W Barstow Ave Unit 101
- 468 W Barstow Ave Unit 102
- 468 W Barstow Ave
- 468 W Barstow Ave
- 468 W Barstow Ave
- 490 W Barstow Ave
- 510 W Barstow Ave
- 478 W Barstow Ave
- 478 W Barstow Ave Unit 101
- 478 W Barstow Ave Unit 102
- 512 W Barstow Ave
- 470 W Barstow Ave Unit 102
- 470 W Barstow Ave Unit 101
- 470 W Barstow Ave
- 470 W Barstow Ave Unit 103
- 470 W Barstow Ave
- 491 W Barstow Ave