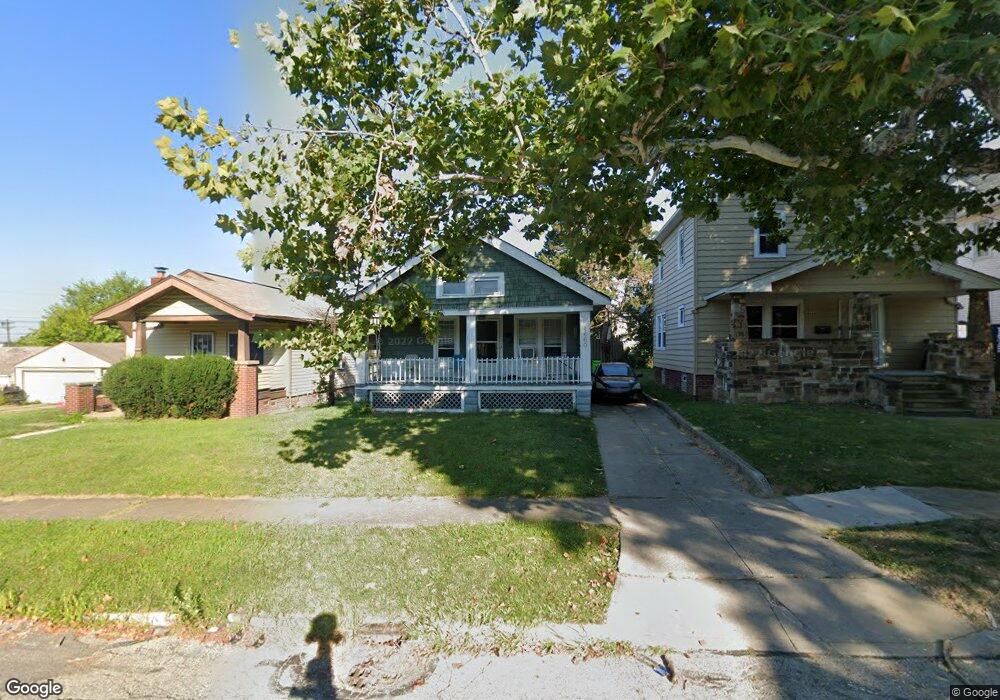
4660 Blythin Rd Cleveland, OH 44125
Estimated Value: $79,746 - $106,000
2
Beds
1
Bath
864
Sq Ft
$110/Sq Ft
Est. Value
About This Home
This home is located at 4660 Blythin Rd, Cleveland, OH 44125 and is currently estimated at $95,437, approximately $110 per square foot. 4660 Blythin Rd is a home located in Cuyahoga County with nearby schools including Garfield Heights High School, North Shore High School, and Holy Name Elementary School.
Ownership History
Date
Name
Owned For
Owner Type
Purchase Details
Closed on
Apr 22, 2008
Sold by
Hsbc Bank Usa Na
Bought by
Equity Trust Co
Current Estimated Value
Purchase Details
Closed on
Jun 29, 2007
Sold by
Bolden Stephanie
Bought by
Hsbc Bank Usa Na
Purchase Details
Closed on
Apr 25, 2005
Sold by
Smolinski Dennis and Smolinski Julie
Bought by
Bolden Stephanie
Home Financials for this Owner
Home Financials are based on the most recent Mortgage that was taken out on this home.
Original Mortgage
$84,830
Interest Rate
7.3%
Mortgage Type
Purchase Money Mortgage
Purchase Details
Closed on
Aug 28, 1986
Sold by
Kastelic Gloria V
Bought by
Smolinski Dennis
Purchase Details
Closed on
Dec 4, 1980
Sold by
Towers Aldred
Bought by
Kastelic Gloria
Purchase Details
Closed on
Jan 1, 1975
Bought by
Towers Aldred
Create a Home Valuation Report for This Property
The Home Valuation Report is an in-depth analysis detailing your home's value as well as a comparison with similar homes in the area
Home Values in the Area
Average Home Value in this Area
Purchase History
| Date | Buyer | Sale Price | Title Company |
|---|---|---|---|
| Equity Trust Co | $11,300 | Attorney | |
| Hsbc Bank Usa Na | $48,000 | Attorney | |
| Bolden Stephanie | $99,800 | Five Star | |
| Smolinski Dennis | $26,500 | -- | |
| Kastelic Gloria | -- | -- | |
| Towers Aldred | -- | -- |
Source: Public Records
Mortgage History
| Date | Status | Borrower | Loan Amount |
|---|---|---|---|
| Previous Owner | Bolden Stephanie | $84,830 | |
| Closed | Bolden Stephanie | $14,970 |
Source: Public Records
Tax History
| Year | Tax Paid | Tax Assessment Tax Assessment Total Assessment is a certain percentage of the fair market value that is determined by local assessors to be the total taxable value of land and additions on the property. | Land | Improvement |
|---|---|---|---|---|
| 2025 | $3,127 | $29,155 | $6,650 | $22,505 |
| 2024 | $3,128 | $29,155 | $6,650 | $22,505 |
| 2023 | $1,815 | $14,880 | $4,550 | $10,330 |
| 2022 | $1,782 | $14,880 | $4,550 | $10,330 |
| 2021 | $1,878 | $14,880 | $4,550 | $10,330 |
| 2020 | $1,629 | $11,900 | $3,640 | $8,260 |
| 2019 | $1,616 | $34,000 | $10,400 | $23,600 |
| 2018 | $1,354 | $11,900 | $3,640 | $8,260 |
| 2017 | $1,084 | $6,930 | $2,870 | $4,060 |
| 2016 | $1,098 | $6,930 | $2,870 | $4,060 |
| 2015 | $1,196 | $6,930 | $2,870 | $4,060 |
| 2014 | $1,196 | $8,470 | $3,500 | $4,970 |
Source: Public Records
Map
Nearby Homes
- 4633 Warner Rd
- 0 Grand Division Ave Unit 5144783
- 4691 Burleigh Rd
- 4768 Burleigh Rd
- 7516 Bancroft Ave
- 8220 Garfield Blvd
- 7610 Rosewood Ave
- 7505 Bancroft Ave
- 8304 Garfield Blvd
- 7606 Vineyard Ave
- 7610 Jeffries Ave
- 7815 Jeffries Ave
- 8614 Bancroft Ave
- 7511 Jeffries Ave
- 8215 Crudele Dr
- 7710 Connecticut Ave
- 7626 Connecticut Ave
- 4643 E 90th St
- 7916 Maryland Ave
- 8511 Jeffries Ave
- 4656 Blythin Rd
- 4664 Blythin Rd
- 4652 Blythin Rd
- 4641 Warner Rd
- 4639 Warner Rd
- 4646 Blythin Rd
- 4646 Blythin Rd Unit 2
- 4646 Blythin Rd Unit 1
- 4646 Blythin Rd Unit Up
- 4637 Warner Rd
- 4657 Warner Rd Unit 4
- 4657 Warner Rd Unit 2
- 4657 Warner Rd Unit 1
- 4657 Warner Rd
- 4657 Warner Rd Unit 3
- 4653 Warner Rd
- 4661 Blythin Rd
- 4642 Blythin Rd
- 4657 Blythin Rd
- 4665 Blythin Rd
Your Personal Tour Guide
Ask me questions while you tour the home.