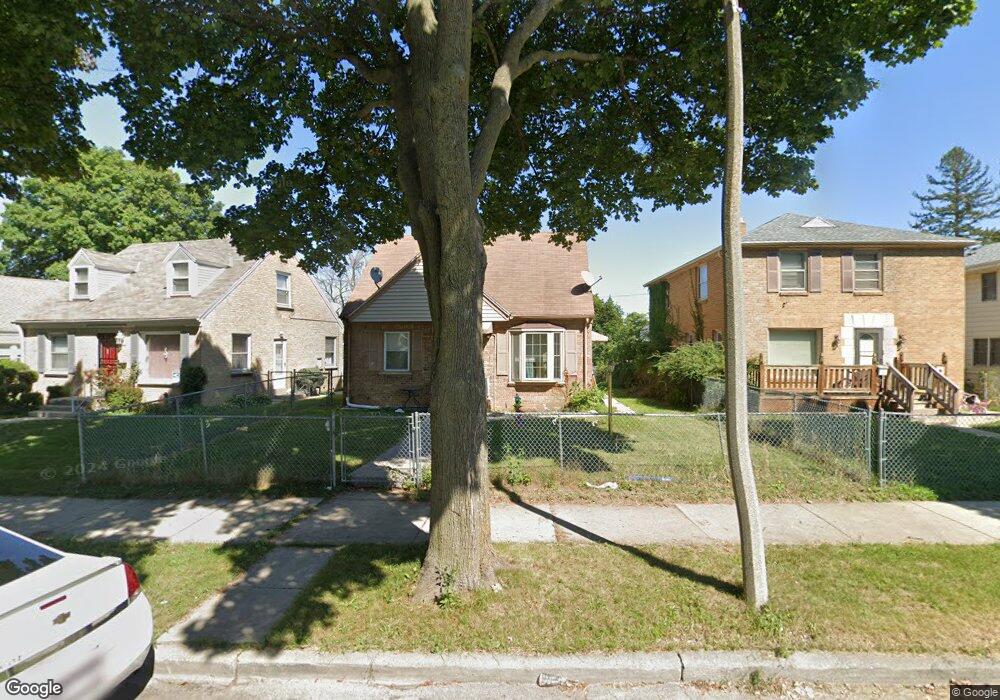
4660 N 19th St Milwaukee, WI 53209
Lincoln Park NeighborhoodEstimated Value: $131,000 - $142,000
3
Beds
1
Bath
1,218
Sq Ft
$114/Sq Ft
Est. Value
About This Home
This home is located at 4660 N 19th St, Milwaukee, WI 53209 and is currently estimated at $138,493, approximately $113 per square foot. 4660 N 19th St is a home located in Milwaukee County with nearby schools including La Escuela Fratney, Craig Montessori School, and Milwaukee German Immersion School.
Ownership History
Date
Name
Owned For
Owner Type
Purchase Details
Closed on
Dec 18, 2019
Sold by
Lotus Property Solutions Llc
Bought by
4660 N 19Th St Llc
Current Estimated Value
Purchase Details
Closed on
Jul 6, 2018
Sold by
Aziom Llc
Bought by
Lotus Property Solutions Llc
Purchase Details
Closed on
Jul 2, 2018
Sold by
Allen Deborah N
Bought by
Aziom Llc
Purchase Details
Closed on
Apr 10, 2014
Sold by
Allen Moore Properties Llc
Bought by
Allen Deborah N
Purchase Details
Closed on
Oct 19, 2007
Sold by
Rutledge Roshelle
Bought by
Allen Moore Properties Llc
Home Financials for this Owner
Home Financials are based on the most recent Mortgage that was taken out on this home.
Original Mortgage
$235,000
Interest Rate
6.45%
Mortgage Type
Credit Line Revolving
Purchase Details
Closed on
Feb 14, 2001
Sold by
United Companies Lending Corp
Bought by
Rutledge Fred and Rutledge Rochelle
Purchase Details
Closed on
Jun 10, 1998
Sold by
Smith Otha Lee
Bought by
Rutledge Roshelle
Create a Home Valuation Report for This Property
The Home Valuation Report is an in-depth analysis detailing your home's value as well as a comparison with similar homes in the area
Home Values in the Area
Average Home Value in this Area
Purchase History
| Date | Buyer | Sale Price | Title Company |
|---|---|---|---|
| 4660 N 19Th St Llc | $54,300 | None Available | |
| Lotus Property Solutions Llc | $60,000 | None Available | |
| Aziom Llc | $200,000 | None Available | |
| Allen Deborah N | -- | None Available | |
| Allen Moore Properties Llc | $82,500 | None Available | |
| Rutledge Fred | $7,200 | -- | |
| Rutledge Roshelle | -- | -- |
Source: Public Records
Mortgage History
| Date | Status | Borrower | Loan Amount |
|---|---|---|---|
| Previous Owner | Allen Moore Properties Llc | $235,000 |
Source: Public Records
Tax History Compared to Growth
Tax History
| Year | Tax Paid | Tax Assessment Tax Assessment Total Assessment is a certain percentage of the fair market value that is determined by local assessors to be the total taxable value of land and additions on the property. | Land | Improvement |
|---|---|---|---|---|
| 2024 | $2,453 | $103,800 | $3,800 | $100,000 |
| 2023 | $2,098 | $88,800 | $3,800 | $85,000 |
| 2022 | $2,041 | $88,800 | $3,800 | $85,000 |
| 2021 | $2,356 | $92,300 | $3,800 | $88,500 |
| 2020 | $2,340 | $92,300 | $3,800 | $88,500 |
| 2019 | $1,535 | $54,300 | $3,800 | $50,500 |
| 2018 | $1,643 | $54,300 | $3,800 | $50,500 |
| 2017 | $1,408 | $54,300 | $4,900 | $49,400 |
| 2016 | $1,535 | $56,100 | $4,900 | $51,200 |
| 2015 | $1,660 | $59,300 | $4,900 | $54,400 |
| 2014 | $1,697 | $59,300 | $4,900 | $54,400 |
| 2013 | -- | $69,800 | $4,900 | $64,900 |
Source: Public Records
Map
Nearby Homes
- 4602 N 20th St
- 4738 N 20th St
- 1820 W Hampton Ave
- 4757 N 21st St
- 4840 N 19th St
- 4469 N 20th St
- 2300 W Cornell St
- 4574 N 24th St
- 4908 N 19th Place
- 4318 N 21st St
- 4306 N 21st St
- 4249 N 18th St
- 4959 N 21st St
- 4215 N 19th St
- 4208 N 19th Place
- 4828 N 25th St
- 1012 W Eula Ct Unit 14
- 4906 N 24th Place
- 2457 W Congress St Unit 2459
- 4465 N 25th St
- 4652 N 19th St
- 4652 N 19th St Unit 4654
- 4666 N 19th St
- 4648 N 19th St
- 4672 N 19th St
- 4642 N 19th St
- 4678 N 19th St Unit 4680
- 4679 N 18th St
- 4675 N 18th St
- 4685 N 18th St
- 4684 N 19th St
- 4669 N 18th St
- 4691 N 18th St
- 4663 N 18th St
- 4657 N 19th St
- 4661 N 19th St
- 4649 N 19th St
- 4667 N 19th St
- 4688 N 19th St
- 4673 N 19th St