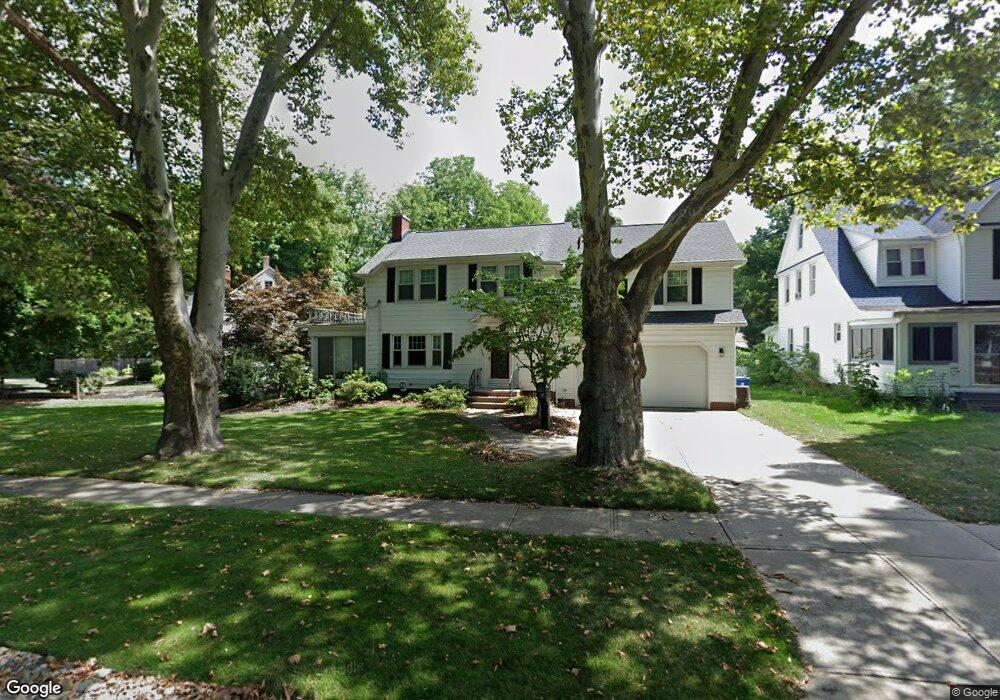
4661 Maple St Willoughby, OH 44094
Downtown Willoughby NeighborhoodEstimated Value: $312,000 - $407,000
4
Beds
3
Baths
1,350
Sq Ft
$266/Sq Ft
Est. Value
About This Home
This home is located at 4661 Maple St, Willoughby, OH 44094 and is currently estimated at $358,859, approximately $265 per square foot. 4661 Maple St is a home located in Lake County with nearby schools including Edison Elementary School, Willoughby Middle School, and South High School.
Ownership History
Date
Name
Owned For
Owner Type
Purchase Details
Closed on
Nov 13, 2012
Sold by
Jarkwicz Maita L
Bought by
Jarkewicz Gary G and Jarkewicz Maita L
Current Estimated Value
Home Financials for this Owner
Home Financials are based on the most recent Mortgage that was taken out on this home.
Original Mortgage
$104,500
Outstanding Balance
$69,614
Interest Rate
2.87%
Mortgage Type
Adjustable Rate Mortgage/ARM
Estimated Equity
$289,245
Purchase Details
Closed on
May 29, 2008
Sold by
Jarkewicz Gary G and Jarkewicz Maita L
Bought by
Jarkewicz Maita L
Purchase Details
Closed on
Mar 30, 1978
Bought by
Jarkewicz Gary D
Create a Home Valuation Report for This Property
The Home Valuation Report is an in-depth analysis detailing your home's value as well as a comparison with similar homes in the area
Home Values in the Area
Average Home Value in this Area
Purchase History
| Date | Buyer | Sale Price | Title Company |
|---|---|---|---|
| Jarkewicz Gary G | -- | Fidelity National Title Comp | |
| Jarkewicz Maita L | -- | Attorney | |
| Jarkewicz Gary D | -- | -- |
Source: Public Records
Mortgage History
| Date | Status | Borrower | Loan Amount |
|---|---|---|---|
| Open | Jarkewicz Gary G | $104,500 |
Source: Public Records
Tax History
| Year | Tax Paid | Tax Assessment Tax Assessment Total Assessment is a certain percentage of the fair market value that is determined by local assessors to be the total taxable value of land and additions on the property. | Land | Improvement |
|---|---|---|---|---|
| 2025 | -- | $95,710 | $14,970 | $80,740 |
| 2024 | -- | $95,710 | $14,970 | $80,740 |
| 2023 | $7,672 | $81,030 | $12,050 | $68,980 |
| 2022 | $4,969 | $81,030 | $12,050 | $68,980 |
| 2021 | $4,991 | $81,030 | $12,050 | $68,980 |
| 2020 | $4,867 | $70,460 | $10,480 | $59,980 |
| 2019 | $4,515 | $70,460 | $10,480 | $59,980 |
| 2018 | $4,447 | $64,450 | $26,080 | $38,370 |
| 2017 | $4,325 | $64,450 | $26,080 | $38,370 |
| 2016 | $4,309 | $64,450 | $26,080 | $38,370 |
| 2015 | $4,191 | $64,450 | $26,080 | $38,370 |
| 2014 | $3,909 | $63,330 | $26,080 | $37,250 |
| 2013 | $3,912 | $63,330 | $26,080 | $37,250 |
Source: Public Records
Map
Nearby Homes
- 4712 Willoughcroft Rd
- 37374 Euclid Ave Unit 37374
- 37366 Euclid Ave
- 4790 Glenwood Ave
- 37518 Arlington Dr
- 4615 Center St
- 4587 Wood St
- 38107 Hastings Ave
- 4566 River St
- 38217 Wilson Ave
- 37309 Sharpe Ave
- 4310 Literary Ln
- 4316 Literary Ln
- 4322 Literary Ln
- 4294 Campus Ln
- 38071 Euclid Ave Unit 2
- 5381 Robinhood Dr
- 5317 Melody Ln
- 3883 Harvard Dr
- 3882 E 365th St
- 37542 Euclid Ave
- 4677 Maple St
- 4685 Maple St
- 37550 Euclid Ave
- 4682 Maple St
- 4642 Willoughcroft Rd
- 4695 Maple St
- 4688 Maple St
- 4666 Willoughcroft Rd
- 4703 Maple St
- 37604 Euclid Ave
- 4696 Maple St
- 4702 Maple St
- 4713 Maple St
- 4680 Willoughcroft Rd
- 37454 Euclid Ave
- 4706 Maple St
- 4698 Willoughcroft Rd
- 4721 Maple St
- 37448 Euclid Ave