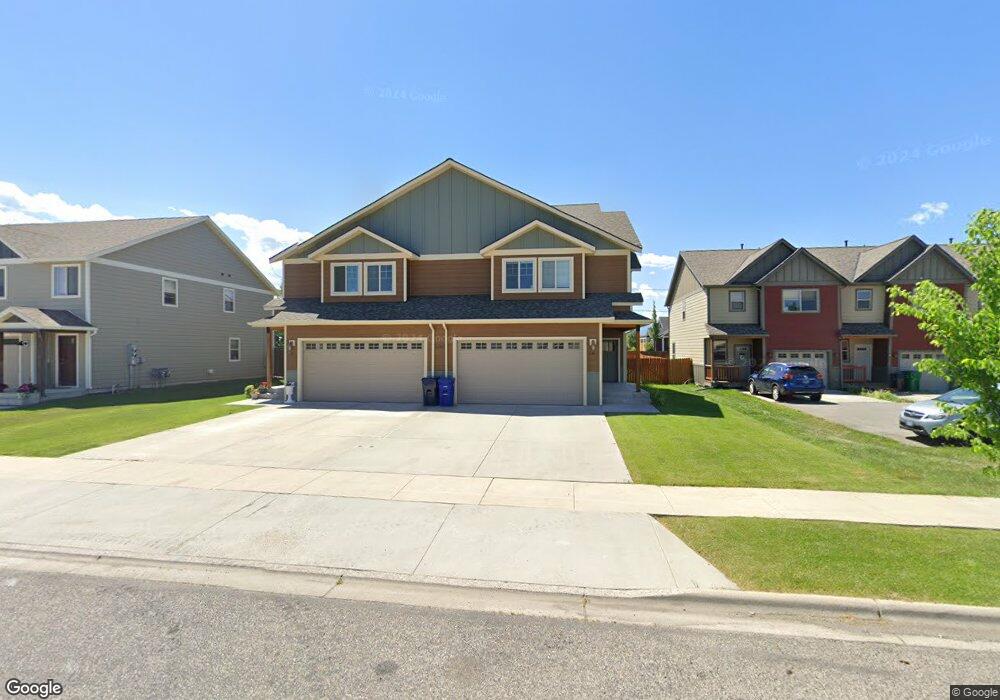
4662 Shadowglen Dr Unit B Bozeman, MT 59718
Flanders Creek NeighborhoodEstimated Value: $541,000 - $561,000
4
Beds
3
Baths
2,190
Sq Ft
$250/Sq Ft
Est. Value
About This Home
This property at 4662 Shadowglen Dr features 4 bedrooms and 2.5 bathrooms within a total of 2,190 square feet. The living room includes a fireplace, providing a cozy gathering space. The kitchen is equipped with a dishwasher and includes a washer and dryer for added convenience. Each bedroom offers ample space, with the master bedroom featuring an en-suite bathroom. The exterior of the home includes a well-maintained yard, suitable for outdoor activities. The property is offered furnished, making it move-in ready. The rental price is available upon request. This home is ideal for families or individuals seeking a spacious and functional living environment.
Ownership History
Date
Name
Owned For
Owner Type
Purchase Details
Closed on
Sep 24, 2009
Sold by
Mountain West Bank Na
Bought by
Haggerty Patrick T and Haggerty Christina M
Current Estimated Value
Home Financials for this Owner
Home Financials are based on the most recent Mortgage that was taken out on this home.
Original Mortgage
$149,940
Outstanding Balance
$97,511
Interest Rate
5.08%
Mortgage Type
Seller Take Back
Estimated Equity
$449,290
Create a Home Valuation Report for This Property
The Home Valuation Report is an in-depth analysis detailing your home's value as well as a comparison with similar homes in the area
Home Values in the Area
Average Home Value in this Area
Purchase History
| Date | Buyer | Sale Price | Title Company |
|---|---|---|---|
| Haggerty Patrick T | -- | Security Title Company |
Source: Public Records
Mortgage History
| Date | Status | Borrower | Loan Amount |
|---|---|---|---|
| Open | Haggerty Patrick T | $149,940 |
Source: Public Records
Property History
| Date | Event | Price | List to Sale | Price per Sq Ft |
|---|---|---|---|---|
| 05/13/2025 05/13/25 | Off Market | $3,900 | -- | -- |
| 04/09/2025 04/09/25 | For Rent | $3,900 | -- | -- |
Tax History
| Year | Tax Paid | Tax Assessment Tax Assessment Total Assessment is a certain percentage of the fair market value that is determined by local assessors to be the total taxable value of land and additions on the property. | Land | Improvement |
|---|---|---|---|---|
| 2025 | $2,563 | $580,100 | $0 | $0 |
| 2024 | $3,235 | $486,000 | $0 | $0 |
| 2023 | $3,674 | $642,200 | $0 | $0 |
| 2022 | $2,859 | $372,900 | $0 | $0 |
| 2021 | $3,155 | $372,900 | $0 | $0 |
| 2020 | $2,813 | $329,000 | $0 | $0 |
| 2019 | $2,877 | $329,000 | $0 | $0 |
| 2018 | $2,285 | $242,100 | $0 | $0 |
| 2017 | $2,137 | $242,100 | $0 | $0 |
| 2016 | $2,347 | $248,500 | $0 | $0 |
| 2015 | $2,349 | $248,500 | $0 | $0 |
| 2014 | $2,542 | $158,311 | $0 | $0 |
Source: Public Records
Map
Nearby Homes
- 4662 Shadowglen Dr
- 4662 Shadowglen Dr Unit A
- 4648 Shadowglen Dr
- 4684 Shadowglen Dr
- 4684 Shadowglen Dr
- 4684 Shadowglen Dr
- 4684 Shadowglen Dr
- 4684 Shadowglen Dr Unit D
- 4684 Shadowglen Dr Unit A
- 4684 Shadowglen Dr Unit C
- 4684 Shadowglen Dr Unit B
- 4626 Shadowglen Dr
- 4709 Shadow Glen
- 4716 Shadowglen Dr
- 4716 Shadowglen Dr
- 4716 Shadowglen Dr
- 4716 Shadowglen Dr Unit A
- 4716 Shadowglen Dr Unit C
- 4716 Shadowglen Dr Unit B
- 4675 Shadowglen Dr
Your Personal Tour Guide
Ask me questions while you tour the home.